


Was Stagflation Really Hyperinflation?
Interest-Rates / HyperInflation Sep 19, 2010 - 06:17 AM GMTBy: LewRockwell

 Gonsalvo Lira writes: In his new post, Gonzalo Lira analyzes the Oil Shock of '79, and the subsequent run up in inflation. He comes to some interesting conclusions about 1979, and how those conclusions might apply to today, if and when there is a run on Treasuries. He writes: "In both 1979 and today, dollars were poised to chase after commodities, following a triggering event. In '79, it was the fall of the Shah of Iran. In 2010, we are waiting for our moment to exit the Treasuries bubble. Therefore, one can look at the events of '79–'82 as a dress rehearsal for what I think will happen today, and in the immediate future – if and when the Treasury bond bubble pops."
If my best friend is the truth, then my next best friend is history.
I've been writing about the possibility of hyperinflation, if there is ever a run on Treasury bonds. My argument has been, Treasuries are the New & Improved Toxic Assets, a termite-riddled house waiting to collapse. If and when there is a run on them, money will flow to a safe haven, which I am predicting will be commodities. As a byproduct of this sell off in Treasuries and buy up of commodities, consumer prices will rise catastrophically in a hyperinflationary event – and the dollar will be left dead on the highway like roadkill.
This scenario got me thinking about the last time there was a panicked run-up in commodities: The stagflation of the 1970's in the United States, specifically the period 1979–1983. Oil nearly doubled in price, gold and silver went hyperbolic. Gas shortages were rampant – the situation almost got to the point where the government considered rationing gasoline. In fact, ration cards were printed – that's how bad things got.
Because of the Oil Shock, the inflation index rose to a peak of 15% – yet unemployment also exploded, reaching almost 11%. This combination of unemployment and inflation was what gave the period its name – stagflation: "Stagnant inflation."
Thinking about this period, I asked myself a simple question: Could the '79 Oil Shock, and subsequent bout of stagflation, be better understood as a period of incipient hyperinflation? And if so, what lessons could it teach us about today?
First, a bit of history:
Starting in late 1977, protests against the regime of the Shah of Iran culminated in his overthrow in January, 1979, and the subsequent disruption of Iranian oil production. From an average of 5.75 million barrels of oil a day, Iranian production dropped catastrophically – at one point to zero – to a new average of about 2.25 million barrels per day.
This event naturally led to oil prices ballooning, from a nominal average of $15 per barrel in 1978, to $25 per barrel in 1979 (data is here). This had a profound impact on inflation throughout the American and world economies.
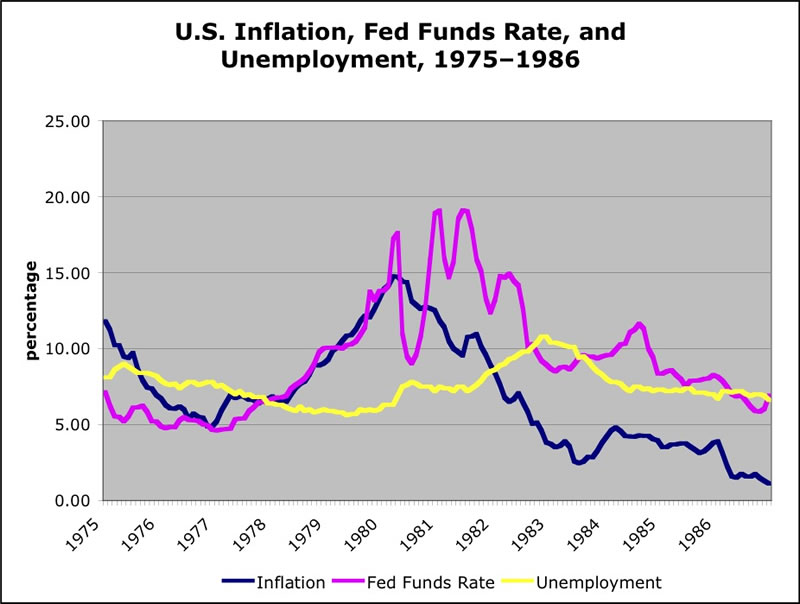
Chart by GL, from cited data
Up to the overthrow of the Shah, the U.S. inflation index had been at a moderate-to-high plateau. The Consumer Price Index (CPI) averaged 6.5% during all of 1977 and for the first third of 1978.
But in the lead-up to the Revolution and the subsequent overthrow of the Shah, inflation got in high gear: For the rest of 1978, inflation averaged 8.13%, and by March of '79 – two months after the Iranian oil supply was disrupted – inflation was tracking at over 10% annually. By the end of 1979, average inflation for the year was 11.22%, and by March of 1980, inflation was peaking just shy of 15% (data is here.)
That was also the winter when gold and silver took off in parallel speculative jags that reached all-time highs – that winter was retrospectively the peak of inflation in the United States.
Keep that date in mind: March of 1980. Annualized inflation: 15%.
Though the inflation index was rising, unemployment hardly budged for a full year after the Oil Shock. Unemployment was at 5.9% when the Shah was overthrown in January of '79. And during the rest of '79 – even though oil prices skyrocketed and the attendant inflation swept the economy – U.S. unemployment was more or less steady at or below 6% – until 1980: Starting that winter, unemployment bumped up to 6.9%, and it didn't look back. Unemployment would eventually reach a plateau of 10%, and stay at that plateau for a whole year (July 1982 to June 1983), peaking at 10.8% in November of '82.
Though unemployment would slowly fall, it wouldn't be until September of 1987 – almost nine years after the start of the crisis – before it reached its pre-Oil Shock level of 5.9% (unemployment data is here).
But during those years – nearly a decade, really – of staggering unemployment, what happened to inflation?
Well, in a word, it got a stake driven through its black heart – but like all scary movies, it was a close call.
Inflation got killed as dead as Dillinger because of the measures taken by Paul Volcker, the Chairman of the Federal Reserve.
As can be seen by the chart, up until Volcker was named Fed Chairman in August of '79, Federal Reserve interest rate policy was playing a game of catch-up with inflation – and inflation was winning.
But in October of '79, Volcker raised the Fed funds rate to 12% in the so-called "Saturday Night Special" – and then kept on raising them. Volcker kept the Fed funds rate up above 15% for most of 1980 and '81, peaking at 19.1%.
That's right: 19.1%. It shocks the senses to look at that number, and then compare it to the current Fed funds rate of 0.25%.
From the graphic, it's crystal clear that unemployment jumped up as a result of the first harsh taste of Volcker rates – in January, three months after the first interest rate hit, unemployment jumped to 6.3%, held steady there through the winter, then jumped to 6.9% in April and 7.5% in May. Then it just kept on climbing after that.
Essentially, Volcker induced a severe recession, in order to beat back inflation. There's really no other way to look at it. Like a doctor administering chemotherapy, Volcker hiked interest rates high enough to kill the cancerous inflation – but he also killed business investment as well, during his reign of double-digit interest rates.
But all's well that ends well – eventually, when inflation was safely taken care of, the Fed lowered its funds rate: Investment returned, the economy picked up, unemployment went down.
And inflation? It went into remission, after Dr. Paul's tough medicine. Since the stagflation period and its successful treatment, inflation as measured by the CPI numbers has been basically a non-issue.
Now, let's double back to take a closer look at what happened back in 1979, and how it might compare to our situation today in 2010:
(A quick note on terms – by the word "inflation," I mean two distinct things: One is the macro-economic event whereby prices rise, due to the expansion of both the economy and the credit environment, which bids up the prices of consumables. This sense is used in opposition to the other three macro-economic events, deflation, disinflation, and hyperinflation. The other meaning of the word "inflation" – or what I sometimes call the inflation index or sometimes the CPI number – is simply the actual percentage rise in prices in an economy, regardless of whether the cause is inflationary or hyperinflationary.)
The cause of the rampant inflation of '79–'81 was an oil shock. It wasn't that the economy was overheating, and consumables (labor and commodities) were being bid up in a growing economy coupled with an expansionary credit environment. Rather, commodities were rising against the dollar – the market was turning on the dollar, and determining that every day, it was worth less vis-à-vis commodities.
What was happening was that, in a very real sense, the dollar was going into a death spiral, when Paul Volcker implemented his psychotically aggressive interest rates.
Note how money supply played no role whatsoever in the inflationary period 1978–1983. Consider the following table:
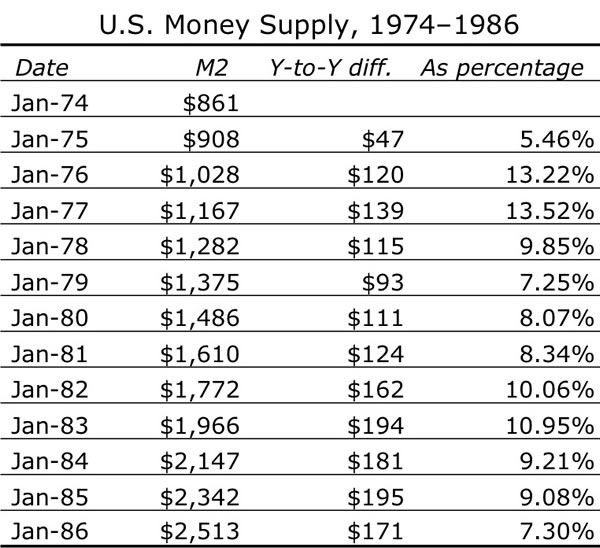
Increase in the money supply was both inverse to high inflation levels some years (like Jan. '75) and inverse to relatively low inflation levels in other years (like Jan. '77). But it also tracked high inflation levels other years (Jan. '82) as well as low inflation levels in still other years (Jan. '86).
Therefore, one cannot make any type of meaningful correlation between money supply and inflation levels, at least not insofar as the period 1974 to 1986.
I would further argue that, if money supply is expanding within mundane historical bounds, then to claim it is either a necessary or (much less) a sufficient condition to affect the inflation index at some indeterminate point in the future is just not accurate.
When inflation was indisputably on the rampage – 1980 – money supply had increased by a mere 8.34%: The low end of the curve. Yet inflation that year was over 13% – even in the teeth of Volcker's medicine.
This is significant: Even with those psycho interest rate levels, inflation didn't instantly roll over and die: Inflation took a long time to draw down – over three years, from peak to trough.
From the March 1980 peak of 14.78% annualized, inflation remained over 14% during that spring of '80, before beginning its slow decline. It averaged 13.58% for 1980, and 10.35% in 1981 – but in 1982 it was just 6.16%, and by 1983 a mere 3.22% (data as per above).
This decline in the inflation index happened over a 39-month period, even as Volcker kept the Fed funds rate, on average, 464 basis points higher than CPI levels. To repeat: Volcker kept the Fed funds rate 4.64% higher than inflation, and it still took over three years to kill the disease.
During all that time, Volcker was under enormous pressure to ease off on interest rates – the cover of Time magazine pretty much says it all, about the mainstream's perception of Paul Volcker: An evil Darth Vader-like figure, smoking a glowing red cigar.
Yet Paul Volcker did what had to be done.
Let's consider a counterfactual: Suppose Volcker had not been the psycho-killer inflation warrior that he was. Suppose he had been timid or slow to act. What would have happened to the dollar?
Easy: The markets in 1980 would have bid up commodities higher even than they did. The Federal Reserve would have continued its ineffective game of catch-up to inflation, as it had done in '78 and most of '79. Gold and silver would not have shot up in price and then come back down – they would have shot up and stayed up at those exorbitant levels, probably to $1,000 and $100 per ounce, respectively. Oil probably would have crossed the $100 a barrel mark as well. Other commodities and foodstuffs would have followed suit.
All this would have meant that inflation would have continued up, unabated. This is because the only thing that stopped inflation's moonshot in the spring of 1980 was Paul Volcker's psycho Fed funds rate.
Had Volcker not applied his medicine, ever-spiraling commodity prices would have sent inflationary tsunamis throughout the U.S. economy – until eventually, there would have been a run on the dollar. If CPI numbers had ever crossed 20% or 25% or some other psychologically important (and so far unknown) number, then it would have been Game Over for the dollar – Zimbabwe/Weimar absurdities would not have been far behind, because there would have been a complete loss of faith in the dollar: After all, a fiat currency is only as strong as the belief it inspires in its holders.
The conclusion is therefore obvious: Paul Volcker prevented hyperinflation from happening in the United States. Had inflation continued rising unabated, the dollar would have collapsed – which would have meant the collapse of the U.S. economy, much as the Soviet Union collapsed in 1991.
If Paul Volcker were a rock star, then I'd be a screaming 15 year-old girl – Tall Paul is my hero. One cannot overstate the political will and strength of character it must have taken for Paul Volcker to resist all the calls to cut interest rates – which were a hysterical clamor, at the time. Had he caved, the Cold War would not have been won, and so our world would be much, much different – for the worse. Those like myself who know this, know how much we owe him – which is why we respect him. As far as I am concerned, he ought to have a white marble statue thirty feet high, placed prominently on the Mall in Washington, D.C., eye to eye with the other great heroes of the Republic. He earned it.
Now, let's ask ourselves: Was this near-catastrophe Paul Volcker saved us from back in 1979 really a case of incipient hyperinflation?
Many people have been using a throwaway line I wrote as a definition of hyperinflation: "Hyperinflation is the loss of faith in the currency." If I do say so myself, it's a nice line – but it's inaccurate.
Hyperinflation is a severe price distortion, that eventually leads to a loss of faith in the currency. In every hyperinflationary event, CPI numbers rise as the prices of consumer necessities rise. Their prices rise for different reasons – which for this discussion are myriad and irrelevant. But what is relevant is, eventually, such price rises skewer the overall economy.
One of the key distortions that hyperinflation inflicts is price distortions on assets, be they equities, bonds or real-estate. By creating a run-up in consumer prices, hyperinflation imbalances the whole of the economy, making bonds, equities and real assets less valuable. This effect has been observed in every undisputed hyperinflationary episode. So apart from the severe rise in CPI numbers between '79 and '82, was there such a hyperinflationary fall in asset prices in the United States?
Yes – without question.
In nominal terms, the New York Stock Exchange was essentially flat – the index was 839 on Jan. 1, 1979, and 875 on Jan. 1, 1982 – which means that in inflation-adjusted terms, equities fell (nominal data is here). Recall that CPI rose 11.22% in 1979, 13.58% in 1980, and 10.35% in 1981 – in other words, 39.39% in those three years.
Average real estate prices, on the other hand, rose nominally though fell in inflation-adjusted terms. Average and median home prices in January '79 were $67,700 and $60,300 respectively, whereas those same numbers in January of '82 were $78,000 and $66,200 (raw data for nominal average price here, and nominal median price here). That represents a 15.2% rise and a 9.8% rise in the average and the median home price. Again, contrasted with a 39.39% rise in CPI during that period, home prices fell during the period of stagflation.
So any way you look at the situation of '79 through '82, it is reasonable to describe it as an incipient hyperinflationary environment. Therefore, the title of our movie ought to be "Stagflation '79: Almost Hyperinflation."
(By the way, this gives lie to the notion common among money supply fetishists that "there aren't enough dollars in the economy to ever start hyperinflation" – of course there are enough dollars: We saw it in '79. Money supply has got nothing to do with hyperinflation. Where there is a shortage or need for a good or commodity, the economy will rebalance itself to meet this new demand. In simple terms, people will somehow always find the cash to purchase their necessities, whatsoever price those necessities might reach. And if the market – for whatever reason – determines that a currency is worth consistently less against the same amount of commodities, then that currency is circling the hyperinflationary drain. The central bank need not inject more money to bring about this end – it can happen without recourse to money printing, or any other central bank or governmental measure.)
Now all of this history is well and good – but how does it apply to the situation we find ourselves in today, in 2010?
Very simple: I have been arguing that Treasury bonds are in a bubble, as they have become the New & Improved Toxic Assets. I have further argued that, at some point in the future, the markets will realize that Treasuries will never be repayed, and if they are, they will be repaid in debased dollars. Therefore, I have argued that when such a realization occurred, the markets would begin exiting Treasuries, and go to commodities as a safe haven.
Contrast this with 1979: At the start of the '79 Oil Shock, commodity prices rose because dollars were chasing commodities. These dollars weren't fleeing from Treasury bonds – if they left Treasuries, it was simply as a byproduct of going towards commodities. As more and more dollars went towards commodities, those commodities bid themselves up, creating inflation.
So in a practical sense, the period we are living in now and the period just before the Oil Shock are identical: In both cases, dollars were poised to chase after commodities, following a triggering event. In '79, it was the fall of the Shah. In 2010, we are waiting for our moment to exit Treasuries.
Therefore, one can look at the events of '79–'82 as a dress rehearsal for what I think will happen today, and in the immediate future, if and when the Treasury bond bubble pops:
Like in '79, there will be a crisis that will trigger a run on commodities. Like '79, the inflation index will start to pick up. Like '79, this will create hyperinflationary distortions in the American economy, which will be seen at least initially as "stagflation."
In my previous writings, I had originally thought that, when the moment arrived when markets lost faith in Treasury bonds, commodities would go hyperbolic immediately, or within a very short time frame.
However, studying the events of '79 more closely, I realize I was wrong: I now no longer think commodity prices will spike hyperbolically and in a reduced time frame. I now think commodity prices – and CPI numbers – will rise initially at an accelerated clip, say at an annualized rate of 5–6% in the first month.
But here is the tragedy: Increased inflation will not be perceived – at least not at first – as anything to get into a twist over. Each subsequent month will see an inflationary rise at a slightly faster pace, adding a percent or two a month to the annualized rate – but at least at first, not only will this not be perceived as anything worrisome, it will be considered a good thing: Because of the current deflationary recession we are in, any pickup in the inflation index will be interpreted as a pickup in the overall economy.
Eventually, however, as inflation continues to rise but the jobs market doesn't really improve, the current American economy will wake up and find it has reached the exact same point that was reached back in March of 1980 – a 15% annual inflation rate.
But here is the key difference: Ben Bernanke and the Federal Reserve cannot raise rates to reign in incipient hyperinflation, like Volcker did in '79.
Apart from the obvious fact that Bernanke is not half the man Paul Volcker is (both literally and figuratively), and therefore lacks the balls and the backbone to do what needs to be done, Bernanke simply does not have the room to maneuver, insofar as the Fed funds rate is concerned.
If there was a run on Treasuries, Bernanke today cannot raise interest rates to retain Treasury holders – if he did, he would wipe out all the Too Big To Fail banks, and break the Treasury of the U.S. Federal government, both of which depend on the Fed's cheap money as completely as if it were oxygen.
Back in 1979, Volcker didn't have this constraint. He could raise rates – but even so, he paid for it with 400 basis points of unemployment.
However, unemployment today is already at 10%, in a soft credit environment. So even if he didn't have the TBTF banks and the Federal government on the cheap money life support, Bernanke cannot raise rates in order to stop a run on Treasuries, stop a run-up on commodities, and stop incipient hyperinflation: The economy is too weak. Adding 400 basis points to the current employment situation – that is, driving U-3 unemployment to 14% or more – would cause political pandemonium, not to mention riots.
Finally, Bernanke won't raise rates – can't raise rates – because of a disease of the mind that he has: Due to Alan Greenspan's pernicious, destructive influence, which I have discussed at some length, Bernanke thoroughly believes that only liquidity injections and cheap money can save the economy – he is looking for inflation. He is so terrified of the American economy circling the deflationary drain, that he is deliberately going in the other direction: He is trying to cause inflation.
Bernanke doesn't realize that inflation is a symptom that can augur many things. He is convinced that inflation means growth – the opposite of deflation. So all his liquidity windows, all his cash infusions to prop up the Too Big To Fail banks and their bankster operators, QE, QE-lite, the forthcoming QE2 – all of it is being carried out by Bernanke so as to cause inflation. He is convinced that inflation will signal that the economy is recovering, and that the Federal Debt will be inflated away, and therefore not break the Federal government finances.
He believes that rising prices will mean that the U.S. economy is about to be saved.
This is why Bernanke is set up to take a hit from hyperinflation: If and when there is a run on Treasuries, and a subsequent run-up of commodities, at least initially, the Federal Reserve under Ben Bernanke will not only do nothing, they will encourage this situation. The Fed and its current leadership will interpret this rise in the CPI number as an indication that "We are on the road to recovery!"
We are not: The first hint of commodity prices rising as the Treasury markets begin to fade will be an indication that hyperinflation is on its way. And by the time we get to our March 1980 moment – by the time we get to 15% annualized inflation index – it will be over.
The next stop will be Zimbabwe.
Gonzalo Lira (Dartmouth '95) is a writer, filmmaker, venture capitalist and economic commentator. He has lived throughout the United States and Latin America, and currently resides in Santiago, Chile. Visit his blog.
© 2010 Copyright Gonsalvo Lira / LewRockwell.com - All Rights Reserved
Disclaimer: The above is a matter of opinion provided for general information purposes only and is not intended as investment advice. Information and analysis above are derived from sources and utilising methods believed to be reliable, but we cannot accept responsibility for any losses you may incur as a result of this analysis. Individuals should consult with their personal financial advisors.
© 2005-2022 http://www.MarketOracle.co.uk - The Market Oracle is a FREE Daily Financial Markets Analysis & Forecasting online publication.