


Why Financial Trouble Brews on the "Home" Front
Housing-Market / US Housing May 13, 2020 - 07:17 PM GMTBy: EWI

The world has been hearing a lot about "homes" in recent months, as in -- "stay there" to help halt the spread of COVID-19.
At the same time, the sales of those homes in the U.S. have seen a significant slowdown.
No doubt about it, the coronavirus has played a big role. Yet, a notable divergence was taking shape in the housing market long before the current pandemic.
Financial history shows that it's happened before.
Around the time of the prior housing bubble peak, the January 2006 Elliott Wave Financial Forecast, which is an Elliott Wave International monthly publication that mainly focuses on U.S. markets, the economy and cultural trends, noted:
Home sales are falling across the board now, but "virtually no investors expect sudden burst of housing bubble," says the headline of a UBS/Gallup Poll of investor attitudes: "Just 1% of all investors expect housing prices next year to exhibit a rapid decline." This sentiment is bearish for real estate prices.
Indeed, U.S. housing prices topped later in 2006. Lower home prices followed slowing sales.
Fast forward to this chart and commentary from the May 2020 Elliott Wave Financial Forecast:
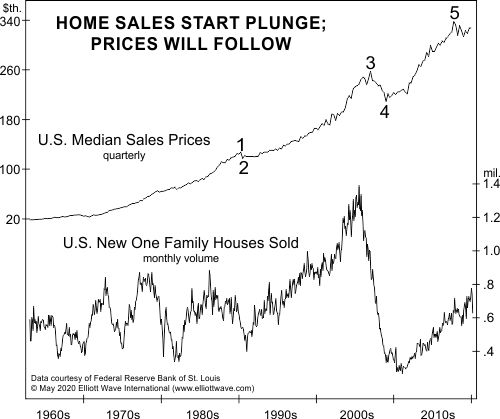
The top graph on the chart shows the median price paid for houses sold in the U.S. ... In addition to the terminal five-wave form of the rise, a key to the forecast is seen on the bottom graph. It shows the dramatic divergence in home sales, which retraced just 45% of the 2005-2010 decline.
Individual homeowners would not be the only group hurt if real estate prices fell. Also be aware of this notable factoid and comment from the August 2019 Elliott Wave Theorist:
Since 2012, private equity firms have been buying an average of 10% of the annual inventory of properties for sale in the U.S. They now own huge portfolios of homes worth hundreds of billions of dollars.
You've just seen the Elliott wave count of U.S. median home sale prices.
Other financial markets are also at crucial junctures, so this is an ideal time to learn how to apply the Elliott wave method yourself.
Yes, the learning process does require work, but it's worth it.
As Elliott Wave Principle: Key to Market Behavior states:
All one really needs to know at the time is whether to be long, short or out, a decision that can sometimes be made with a swift glance at a chart and other times only after painstaking work.
If you're ready to learn, tap into the insights of The Wave Principle Applied, which is a 1-hour course that you can access for free through May 15 by joining Club EWI (membership is also free).
Keep in mind that Elliott Wave International normally sells this course for $99, so take advantage of this limited-time opportunity to learn how to spot Elliott wave patterns on chart patterns of financial markets -- 100% free.
Here's the link that gets you started: The Wave Principle Applied.
This article was syndicated by Elliott Wave International and was originally published under the headline . EWI is the world's largest market forecasting firm. Its staff of full-time analysts led by Chartered Market Technician Robert Prechter provides 24-hour-a-day market analysis to institutional and private investors around the world.
© 2005-2022 http://www.MarketOracle.co.uk - The Market Oracle is a FREE Daily Financial Markets Analysis & Forecasting online publication.