


Junk Bond Defaults Worst Since Great Depression, Why Is the Stock Market Rallying?
Interest-Rates / Corporate Bonds Sep 11, 2009 - 03:06 AM GMTBy: Mike_Shedlock

 Numerous people have asked for an update to Corporate Bond Spreads Key To Continued S&P Rally.
Specifically, inquiring minds are interested in my statement "It will pay to keep one eye on the credit markets to help ascertain long-term equity direction. In August of 2007 the corporate bond market cracked wide open. Although the S&P 500 made a new high in November, the corporate bond market didn't. It was the mother of all warning calls that most missed."
Here are some charts that show what I mean.
S&P 500 vs. BAA Corporate Bonds vs. 10-Year Treasuries
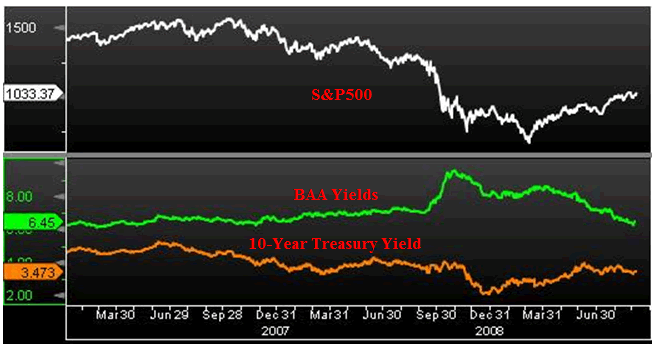
The above charts shows that BAA corporate bond yields (one step above junk) were rising throughout 2008 and started soaring right before the stock market waterfall plunge. The 2009 rally started in March with the BAA yield dropping and the 10-year treasury yield rising.
A falling BAA-10YR spread is a measure of increased willingness for market participants to take on risk as the following chart shows.
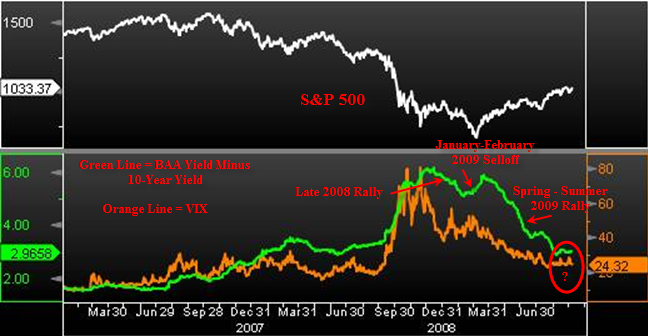
The above charts courtesy of Chris Puplava. Annotations by me. Rising BAA to 10-year treasury yield spreads starting August 2007 was a big warning sign.
Not many have access to a Bloomberg terminal that produced those charts but here is something that everyone can easily watch.
HYG - High Yield Bond Fund vs. S&P 500 SPY
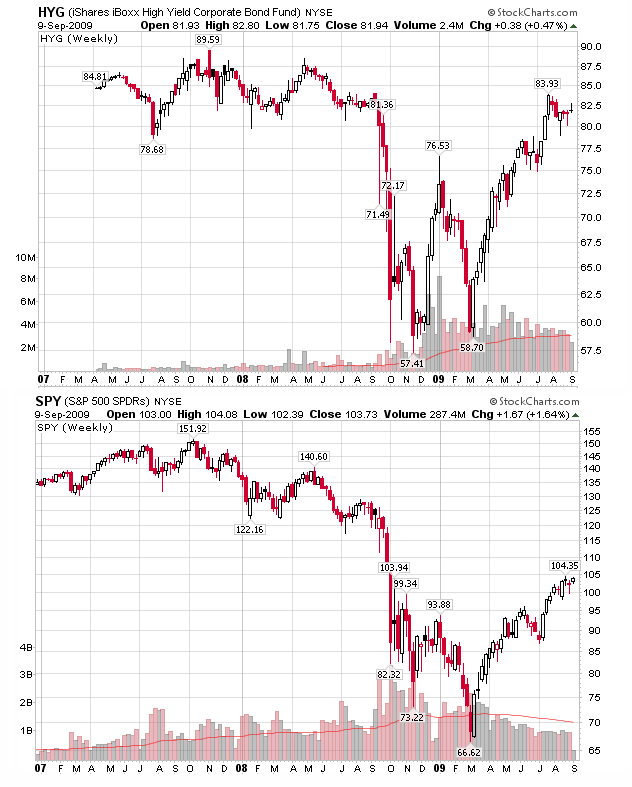
HYG - High Yield Bond Fund vs. S&P 500 SPY
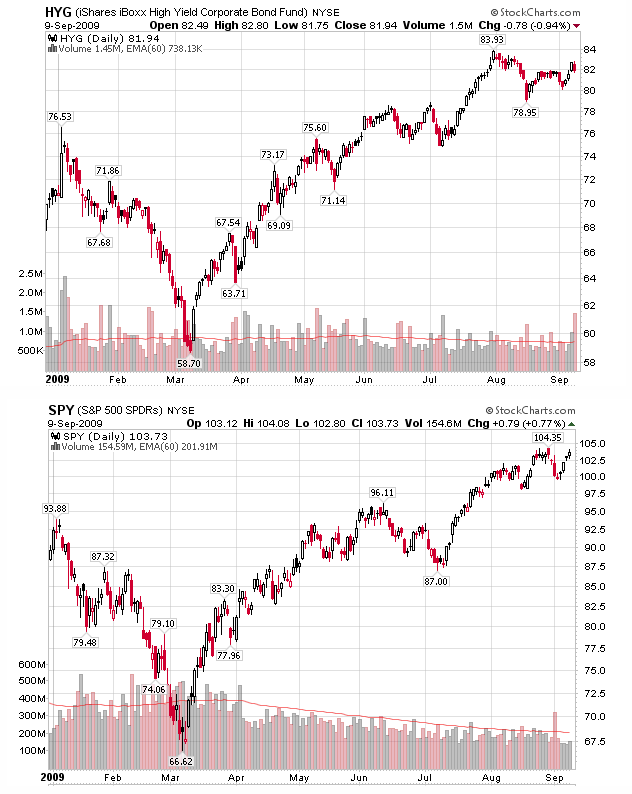
Here is a closeup detail for 2009.
Junk Bond Default Rate Worst Since Great Depression
Last week the junk bond default rate hit 10.2 percent.
The U.S. junk bond default rate rose to 10.2 percent in August from 9.4 percent in July as the worst recession since the 1930s left more companies unable to pay off debt, Standard & Poor's data showed on Thursday.
The default rate is expected to rise to 13.9 percent by July 2010 and could reach as high as 18 percent if economic conditions are worse than expected, S&P said in a statement.
Default rates have surged from less than 1 percent in 2007 as an economic downturn squeezed corporate revenues and a global credit crunch dried up funding. A 13.9 percent default rate would be the highest since the Great Depression of the 1930s, when it hit 15.9 percent.
Eighteen companies defaulted in August, bringing the year-to-date total to 147. "Credit metrics in the U.S. show continued deterioration of credit quality and restricted lending conditions," S&P said.Inquiring minds have been asking "With Junk bonds defaults so miserable, why is the stock market rallying?"
The answer is falling yield spreads indicate an increased appetite for risk, thus debt deals are getting financed. That combination is very supportive of equity prices.
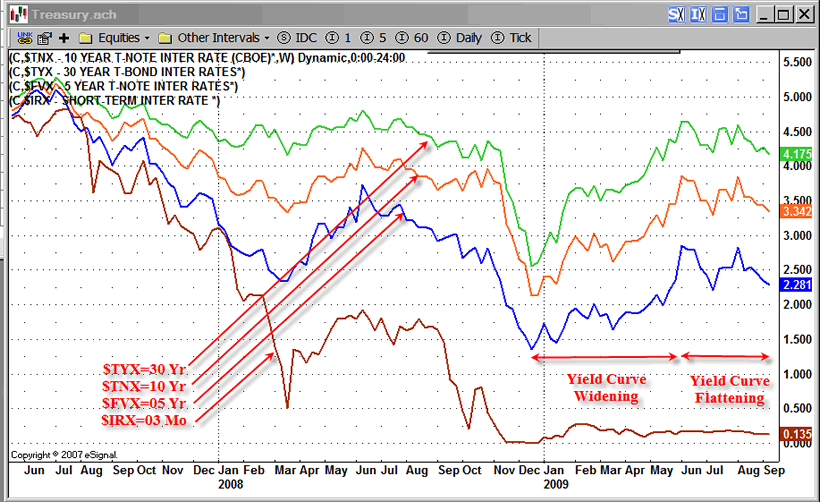
Treasury Yield Curve
The above chart is one more measure of risk I am following. A widening yield curve is a sign of a strengthening economy, inflation fears (warranted or not), and/or proxy for risk appetite. The lines are closing marks. Intraday, the 10-Year yield ($TNX) spiked above 4. It is now sitting at 3.34, reflecting 66 basis points of curve flattening. Yields on $TYX (the 30 year long bond), and $FVX (five-year treasuries), have come in as well.
The corporate debt market is still in control, but we now have a warning sign from treasuries yields about the strength of the so-called recovery. This rally is extremely long in the tooth, but the fact still remains: as long as corporate bonds hold up, huge equity selloffs are unlikely.
By Mike "Mish" Shedlock
http://globaleconomicanalysis.blogspot.com
Click Here To Scroll Thru My Recent Post List
Mike Shedlock / Mish is a registered investment advisor representative for SitkaPacific Capital Management . Sitka Pacific is an asset management firm whose goal is strong performance and low volatility, regardless of market direction.
Visit Sitka Pacific's Account Management Page to learn more about wealth management and capital preservation strategies of Sitka Pacific.
I do weekly podcasts every Thursday on HoweStreet and a brief 7 minute segment on Saturday on CKNW AM 980 in Vancouver.
When not writing about stocks or the economy I spends a great deal of time on photography and in the garden. I have over 80 magazine and book cover credits. Some of my Wisconsin and gardening images can be seen at MichaelShedlock.com .
© 2009 Mike Shedlock, All Rights Reserved
Mike Shedlock Archive |
© 2005-2022 http://www.MarketOracle.co.uk - The Market Oracle is a FREE Daily Financial Markets Analysis & Forecasting online publication.