


Stock Market Rally Continues As Unprecedented Stimulus Measures Starting to Take Root
Stock-Markets / Financial Markets 2009 Apr 19, 2009 - 09:00 AM GMT

 Spring is in the air – at least in the Northern Hemisphere and on global bourses. Last week marked the sixth consecutive up-week for stock markets as investors’ risk appetite returned amid signs of global economies and the financial sector embarking on the road to recovery.
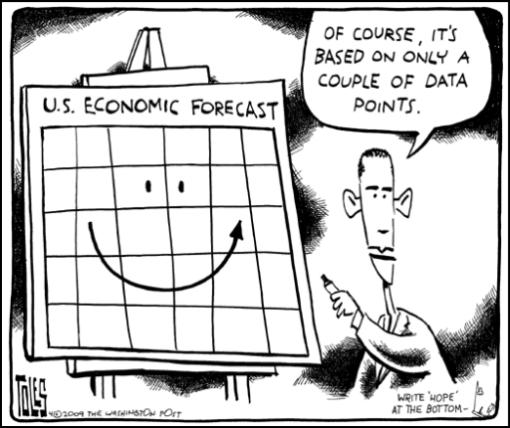
Source: Tom Toles, The Washington Post.
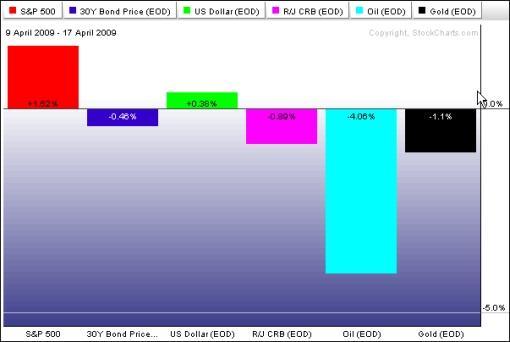
Speculation that the unprecedented stimulus measures are starting to take root saw the safety appeal of government bonds diminishing, despite the buying support from central banks’ buying programs. Similarly, gold bullion struggled to find traction as investors continued to unwind positions. Silver and oil also languished in the red, but copper, other industrial metals and soya beans surged ahead.
The performance of the major asset classes is summarized by the chart below, courtesy of StockCharts.com. A picture tells a thousand words …
Equity investors breathed a sigh of relief with Goldman Sachs (GS), JP Morgan (JPM), Citigroup (C) and General Electric (GE) all reporting better-than-expected first-quarter results. Goldie also announced a $5 billion capital raising. Meanwhile, the US Federal Reserve has told banks to keep mum on the results of “stress tests” that will gauge their ability to weather the recession, Bloomberg reported. This is to ensure the report cards don’t leak during earnings conference calls scheduled for this month.
The quote du jour belongs to Elizabeth Warren, chairperson of the Congressional Oversight Panel on Tarp, who said (as paraphrased by Jon Stewart): “Capitalism without bankruptcy is like Christianity without hell.” Fed chairman Ben Bernanke was in agreement, saying that “… any firm that cannot meet its obligations should bear the consequences of the marketplace. But recent circumstances have been truly extraordinary.”
Global stock markets, led by financials, added to the gains of the rally that commenced on March 10 (see table below). The MSCI World Index gained 2.3% (YTD -4.2%), the MSCI Emerging Markets Index 1.7% (YTD +13.5%) and the S&P 500 Index 1.5% (YTD -3.7%). These indices have risen by 28.0%, 32.6% and 28.5% respectively since the March lows.
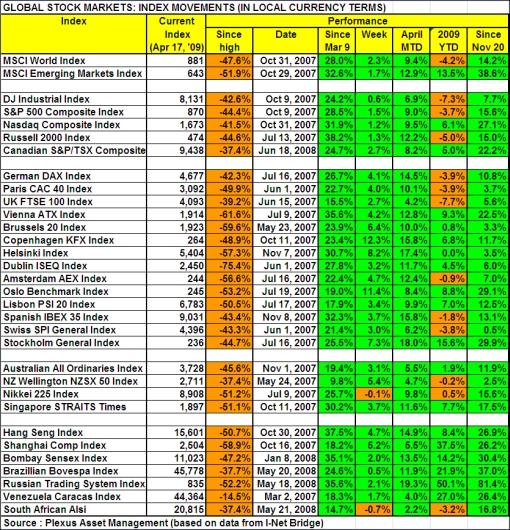
Returns around the world ranged from top performers Ukraine (+15.2%), Denmark (+12.3%) and Norway (+11.4%) to Côte d’Ivoire (-7.0%), Kenya (‑2.8%) and Ecuador (-2.6%) experiencing selling pressure. The Japanese Nikkei 225 Average (-0.1%) was the only major index not making headway, notwithstanding the government’s announcement to support the stock market. (Click here to access a complete list of global stock market movements, as supplied by Emerginvest.)
Focusing on the US stock markets, it is interesting to note that stocks across a broad front have participated in the six-week old rally. This is also illustrated by the graph below which, in addition to the customary market breadth measures, shows the outperformance since the March lows of the Rydex S&P Equal Weight ETF (+40.8%) compared with the S&P 500 Index (+28.5%) – a market-capitalization weighted index.
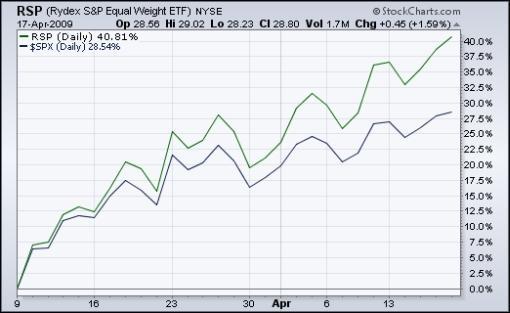
Source: StockCharts.com
John Nyaradi (Wall Street Sector Selector) reports that the strongest exchange-traded funds (ETFs) on the week were the Claymore/Delta Global Shipping (SEA) (+14.8%), iShares Dow Jones US Home Construction (ITB) (+11.9%) and SPDR S&P Homebuilders (XHB) (+11.2%). On the other end of the performance scale the Market Vectors Gold Miners (GDX) (-6.3%), ProShares Short Financials (SEF) (-4.9%) and United States Oil (USO) (‑4.0%) performed poorly.
On the credit front, the cost of buying credit insurance for US and European companies eased during the past week as shown by the narrower spreads for both the CDX (North American, investment grade) Index (down from 183 to 177) and the Markit iTraxx Europe Index (down from 156 to 146).
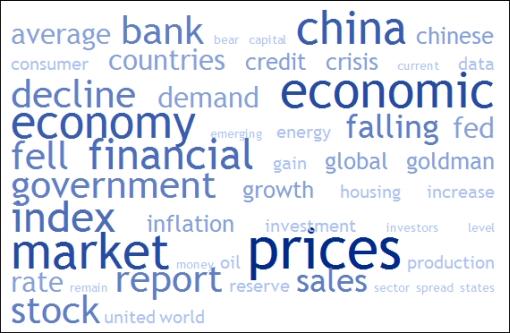
Next, a tag cloud of all the articles I read during the past week. This is a way of visualizing word frequencies at a glance. Key words such as “economic”, “economy”, “market”, “prices” and “China” featured prominently, with others such as “bank” and “government” just a notch behind.
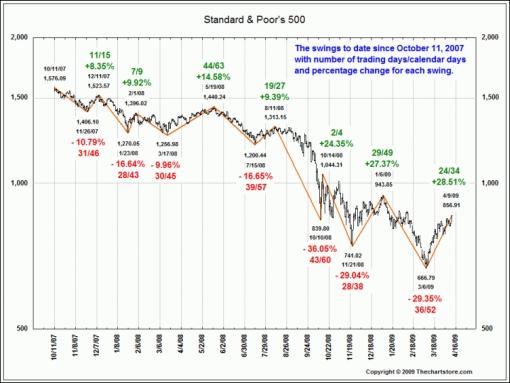
Turning to the stock market again, the chart below from Ron Griess’s The Chart Store puts the movements of the S&P 500 since the beginning of 2007 in perspective.
As shown in the table below, the 50-day moving averages have been cleared comfortably by all the major US indices and the early January highs are the next important targets. As a matter of fact, the Nasdaq Composite Index is already 1.2% above this level. It has to rise by a further 6.7% in order to reach the key 200-day moving average – an indicator often used to distinguish between primary bull and bear markets. On the downside, the levels from where the nascent rally commenced on March 9 should hold in order for the upward trend to remain intact.
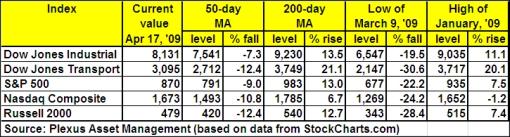
From a technical perspective, a primary bear market still exists as long as the major indices remain below the January highs and the 200-day moving averages. Many of the rally’s leaders (indices and sectors) seem to be running into major resistance at these levels and look susceptible to retrace at least a portion of the gains since the March low.
Further evidence of a short-term top in the making comes from a chart showing the percentage of S&P 500 stocks trading above their 50-day moving averages. Altogether 90% of the stocks are currently trading above their 50-day lines – higher than the 80% level typically seen at prior peaks during this bear market. This looks overdone in the short term, but for a primary uptrend to manifest itself the bulk of the index constituents should remain above the 50-day line and also trade above their 200-day averages (26% at the moment).
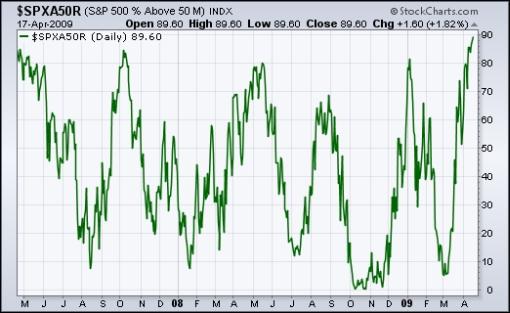
Source: StockCharts.com
Still on the topic of whether stock markets are running out of gas, Adam Hewison of INO.com prepared a short technical analysis of the S&P 500’s most likely direction and important chart levels. Click here to access the video clip.
The sharp fall (-4.0%) on Friday in Taiwan – one of the strongest stock markets over the past few weeks – may be a precursor of short-term downside potential in other markets. (Click here for a chart.)
“Mistaking a temporary jump for a sustained bull market can be costly. In 41 so-called bear market rallies since 1928 – gains of more than 10% that are later wiped out – equities fell an average 25% after peaking,” warned Laszlo Birinyi (Birinyi Associates) via Bloomberg. “Buying stocks is like crossing Fifth Avenue when the light is red. You might make it, but the odds are not with you.”
David Fuller (Fullermoney) summarized the outlook as follows: “We are seeing nothing less than the greatest global asset reflation in history. This is bullish and all that bearish sentiment tells us that there is still plenty of cash on the sidelines, capable of fuelling additional gains in stock markets and commodities over at least the medium term.
“On a short-term basis, stock markets are technically overbought as the rally continues for a sixth consecutive week. However, this persistent, non-volatile strength provides clear evidence that demand has regained the upper hand. Consequently, downside risk should be limited to a temporary reaction and consolidation of recent gains, before cash on the sidelines supports additional strength.”
Interestingly, analyst earnings revisions for the S&P 1500 Index and most sectors have once again improved during the past week. According to Bespoke, analysts have cut estimates for 772 companies in the S&P 1500 and raised estimates for 290 over the last four weeks. This works out to a net of -482, which represents 32.1% of the Index - the highest level since late September. “… rather than dismiss these numbers as negative, we would continue to note that it’s a start, and before things start to get better, they have to get less worse,” said Bespoke.
Dozens more companies report on their first-quarter results next week, including heavy-weights like Bank of America (BAC), IBM (IBM), Apple (AAPL), Boeing (BA) and Morgan Stanley (MS).
For more discussion about the direction of stock markets, also see my recent posts “Video-o-rama: Are stock market gains built on solid foundations?“, “Moving averages - indicating bull or bear markets?“, “Technical talk: Buying power not tapped out yet” and “Commodities have turned the corner“. (And do make a point of listening to Donald Coxe’s webcast of April 17, which can be accessed from the sidebar of the Investment Postcards site.)
Twitter
In case you missed last week’s paragraph on Twitter, I regularly post short comments (maximum 140 characters) on topical economic and market issues on this fascinating medium. For those not doing so already, you can follow my “tweets” by clicking here. The Twitter posts also appear on my Facebook page and in the sidebar of the Investment Postcards site.
Economy
“Global business confidence remains very weak. Survey responses regarding sales, hiring, and equipment investment are notably poor. Businesses also report little pricing power,” said the latest Survey of Business Confidence of the World conducted by Moody’s Economy.com. However, it is encouraging that businesses are becoming steadily less negative about the economy’s prospects later this year.
Fed chairman Bernanke introduced the term “green shoots” a few weeks ago and it has since become a part of economic and financial vocabulary.

Source: The New York Times, April 7, 2009 (hat tip: Northern Trust).
How widespread are the green shoots? I posted a short article last week on a recent research report by the Goldman Sachs Global Economics team, showing that the global economy appears to be stabilizing. To monitor whether economic data are indeed improving they have developed a simple Diffusion Index, recording whether a particular data series has increased or decreased relative to its previous reading. Thirty-four monthly economic data points from the US, Europe, China, Japan, Brazil, Russia, Korea and India are analysed.
After having languished below 50 since the spring of 2007, the Diffusion Index increased to above 50 in February and March. Any reading between 0 and 50 indicates the data are deteriorating, whereas above 50 implies improvement.
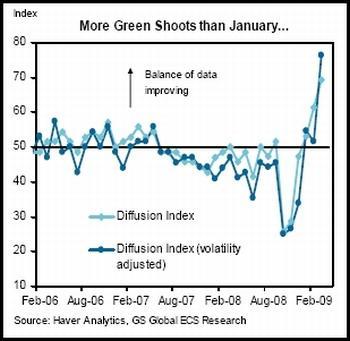
When looking regionally, the Goldman Sachs economists believe the worst of the cycle has been seen in the US and the UK, but this does not appear to be the case in Euroland and Japan.
Turning to the US, a snapshot of the week’s economic data is provided below. (Click on the dates to see Northern Trust’s assessment of the various data releases.)
April 17
• University of Michigan Consumer Sentiment Index - improvement in outlook for consumers
April 16
• Housing Starts appear to be establishing a bottom
• Jobless Claims - mixed news
• Philadelphia Fed Factory Survey - is regional progress a precursor of nationwide progress?
April 15
• Lower energy and food prices help to contain inflation
• Factory sector remains significantly weak
• Home Builders Survey shows optimism
April 14
• Retail Sales - story of weak consumer spending
• Wholesale prices report - benign figures
• Small businesses remain gloomy about the future
According to Moody’s Economy.com, the Federal Reserve’s Beige Book report - covering most of March and early April - indicated that overall economic conditions continued to deteriorate or remained weak. However, nearly half of the 12 reporting Fed Districts noted that in some sectors, conditions appeared to be moderating or stabilizing. Reports of a deceleration in the pace of decline or some levelling off appeared mainly in manufacturing and residential real estate.
Pulling the strings together, Asha Bangalore (Northern Trust) said: “… ‘green shoots’ are appearing simultaneously with spring and we will be watching for more signals that will herald the economic recovery. For now, it is not self-sustaining economic growth yet. Stability in the financial sector with clean balance sheets of banks and a working credit machine will be necessary for self-sustaining economic growth. The positive economic signals are small but significant because a further slide in economic activity is not the scenario one would want to envision in the sixth quarter of a recession.”
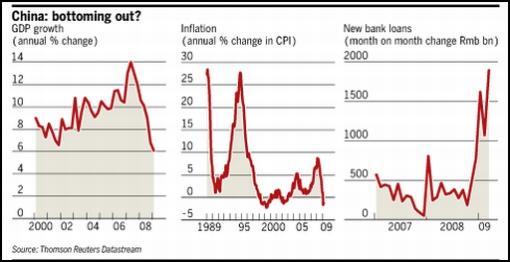
Back to the global economy, real GDP growth in China slowed from 6.8% in the fourth quarter of last year to 6.1% in the first quarter, the slowest year-over-year growth rate in about nine years.
Source: Financial Times, April 16, 2009.
Jay Bryson (Wachovia Economics Group) commented as follows: “In our view, the Chinese economy probably bottomed in the first quarter and growth should strengthen over the next few quarters. Although the global economy is very weak at present, many economies appear to be nearing inflection points. Therefore, exports should exert less drag on the Chinese economy over the next few quarters.
“In addition, there is still a fair amount of fiscal and monetary stimulus in the pipeline in China. Although the Chinese economy is not large enough to have a significant effect on the US economy, stronger growth in China should help American exports on the margin.”

Source: Dilbert.com, April 16, 2009 (hat tip: News N Economics).
Week’s economic reports
Click here for the week’s economy in pictures, courtesy of Jake of EconomPic Data.
| Date | Time (ET) | Statistic | For | Actual | Briefing Forecast | Market Expects | Prior |
| Apr 14 | 8:30 AM | Core PPI | Mar | 0.0% | 0.0% | 0.1% | 0.2% |
| Apr 14 | 8:30 AM | PPI | Mar | -1.2% | 0.0% | 0.0% | 0.1% |
| Apr 14 | 8:30 AM | Retail Sales | Mar | -1.1% | 0.5% | 0.3% | 0.3% |
| Apr 14 | 8:30 AM | Retail Sales ex-auto | Mar | -0.9% | 0.2% | 0.0% | 1.0% |
| Apr 14 | 10:00 AM | Business Inventories | Feb | -1.3% | -1.2% | -1.2% | -1.3% |
| Apr 15 | 8:30 AM | Core CPI | Mar | 0.2% | 0.1% | 0.1% | 0.2% |
| Apr 15 | 8:30 AM | CPI | Mar | -0.1% | 0.1% | 0.1% | 0.4% |
| Apr 15 | 8:30 AM | Empire Manufacturing | Apr | -14.65 | -36.0 | -35.0 | -38.2 |
| Apr 15 | 9:00 AM | Net Long-Term TIC Flows | Feb | $22.0B | NA | $14.0B | -$36.8B |
| Apr 15 | 9:15 AM | Capacity Utilization | Mar | 69.3% | 69.7% | 69.6% | 70.3% |
| Apr 15 | 9:15 AM | Industrial Production | Mar | -1.5% | -0.9% | -0.9% | -1.5% |
| Apr 15 | 10:30 AM | Crude Inventories | 04/10 | +5670K | NA | NA | +1645K |
| Apr 15 | 2:00 PM | Fed’s Beige Book | - | - | - | - | - |
| Apr 16 | 8:30 AM | Building Permits | Mar | 513K | 545K | 549K | 564K |
| Apr 16 |
© 2005-2022 http://www.MarketOracle.co.uk - The Market Oracle is a FREE Daily Financial Markets Analysis & Forecasting online publication.