


Stock Markets Have Never Made a Final Bear Market Bottom in March
Stock-Markets / Stocks Bear Market May 06, 2009 - 12:14 AM GMTBy: Donald_W_Dony

 This article is an update on the April 22 Market Minute. As the March rally continues to advance into its ninth week, many financial reports are now indicating that the bear market is over and the low in March was the final bottom. Though the possibility is present, the probability remains remote. Since 1946, there has never been a final bottom in March. In the 12 bear markets over the past 70 years, six of the troughs developed in October and three occurred in May and June but none ended in March. However, in all of the bear markets, deep drops in March were present.
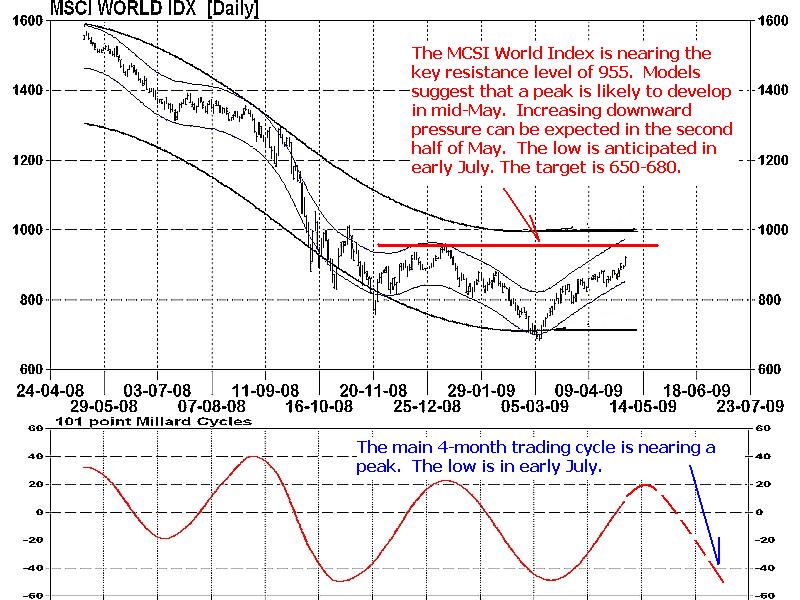
A review of the chart 1 illustrates that the MSCI World Index has been slowly advancing up to the key 955 resistance line. Monte Carlo simulation (refer to the chart in the April 22 Market Minute) stated that there was a 95% probability that the index will trade outside of the 903-1375 zone over the next 100 days. The main 4-month trading cycle is expected to reach a peak in mid-May. This would suggest another 1-2 weeks of upward movement is still possible.
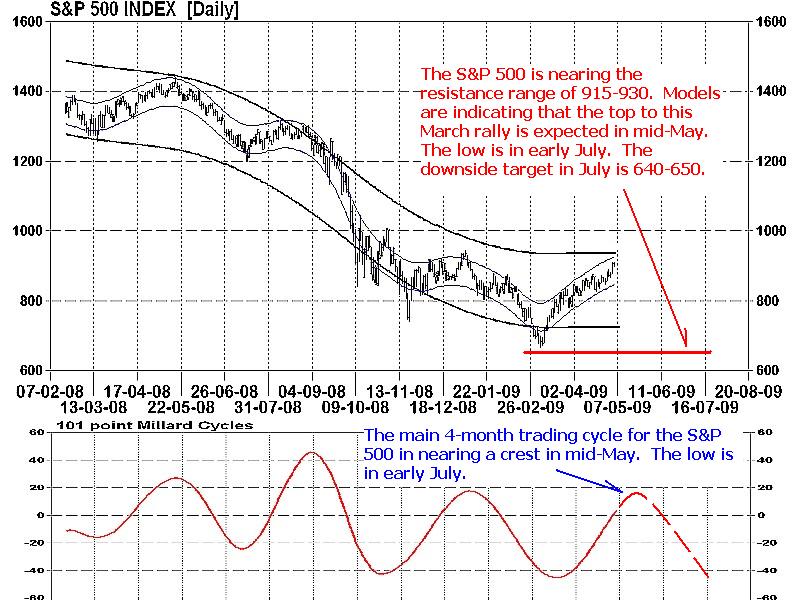
The S&P 500 (Chart 2) is following a similar pattern as the global MSCI Index. Overhead price resistance is evident at 915-930 and the index's main trading cycle is close to the top. Monte Carlo simulation points to a 95% probability that the S&P 500 will trade outside of the 906-1253 range over the next 100 days. Technical evidence therefore suggests the second half of May should develop increasing downward pressure. A reversal in the current rally will be signaled once the index closes at or below 860.
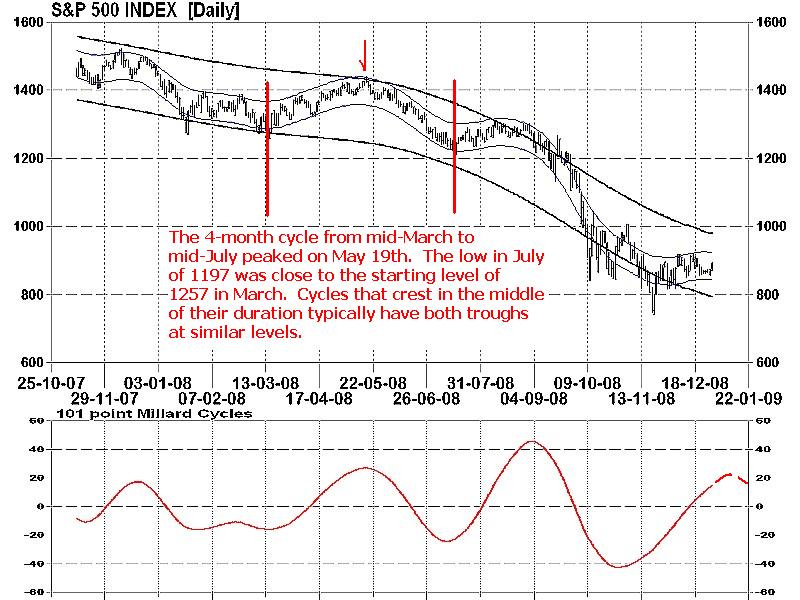
Models indicate that this current market is performing in a same pattern as the March-to-July 2008 cycle (Chart 3). After nine weeks of steady increases from the early March trough, the peak in that formation crested in mid-May. The final low in July 17 developed slightly lower than the March starting level. This trading action is a standard process with financial indexes. Market cycles that advance in the first half of their duration and peak in the middle, normally decline back to the original starting level in the second half.
Bottom line: The chance of a top to this current March-to-July 4-month cycle increases greatly by mid-May. Models suggest the likelihood of a reversal of this advance should build by the second half of May. But as market patterns often repeat themselves, this coming low in July is likely to only be at or slightly below the early March levels.
Though the equity markets clearly appear to forming a bottoming foundation in 2009, the date of the greatest probability (50/50) for the final low still rests with October and not with March.
Investment approach: Investors may wish to remain alert over the next 1-2 weeks for stalling of the MSCI World Index at approximately the 955 resistance level. Weakness can develop quickly within these present market conditions.
Your comments are always welcomed.
By Donald W. Dony, FCSI, MFTA
www.technicalspeculator.com
COPYRIGHT © 2009 Donald W. Dony
Donald W. Dony, FCSI, MFTA has been in the investment profession for over 20 years, first as a stock broker in the mid 1980's and then as the principal of D. W. Dony and Associates Inc., a financial consulting firm to present. He is the editor and publisher of the Technical Speculator, a monthly international investment newsletter, which specializes in major world equity markets, currencies, bonds and interest rates as well as the precious metals markets.
Donald is also an instructor for the Canadian Securities Institute (CSI). He is often called upon to design technical analysis training programs and to provide teaching to industry professionals on technical analysis at many of Canada's leading brokerage firms. He is a respected specialist in the area of intermarket and cycle analysis and a frequent speaker at investment conferences.
Mr. Dony is a member of the Canadian Society of Technical Analysts (CSTA) and the International Federation of Technical Analysts (IFTA).
Donald W. Dony Archive |
© 2005-2022 http://www.MarketOracle.co.uk - The Market Oracle is a FREE Daily Financial Markets Analysis & Forecasting online publication.