


Gold, Silver, Oil and Stocks Technical Trading Summer Forecasts
Stock-Markets / Financial Markets 2009 May 07, 2009 - 04:33 AM GMTBy: Chris_Vermeulen

 I have put together some interesting charts using the weekly time frame because they provide a cleaner picture of what to look for in the financial markets over the next 3-6 months.
Hello, I'm Chris Vermeulen founder of TheGoldAndOilGuy and NOW is YOUR Opportunity to start trading GOLD, SILVER & OIL for BIG PROFITS. Let me help you get started.
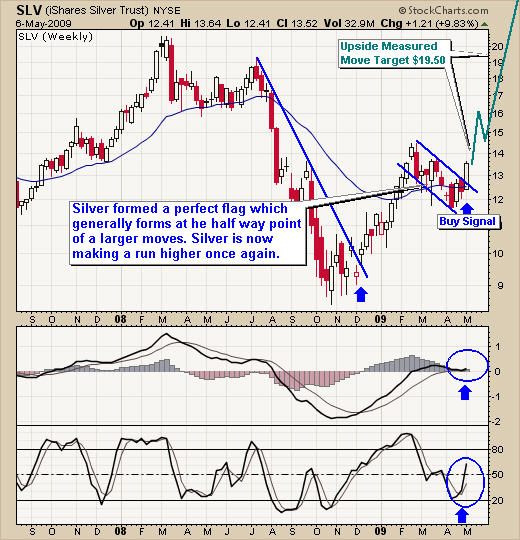
Silver Weekly Outlook & Technical Analysis
Silver is a super charged gold investment in my opinion. It moves much more freely than gold because so few investors actually trade/own it. When general investors are looking for a safe haven they buy gold. Active traders and seasoned investors like to buy silver because it can post massive returns while gold is bogged down with tens of thousands of sellers.
I find silver moves in a more emotional pattern (panic buying and panic selling), and with that comes volatility for sharp parabolic spikes and fast sell offs.
This chart below is the weekly chart showing a clean bull flag breakout. Using technical analysis we can calculate a measured move which is about the $19.50 level. This is done by measuring the rally from the bottom in October to the top in February. If you calculate this move again from the high then you arrive at the $19.50 -$20 level.
If we see this price action over the following weeks, then we will be cautious for a double top pattern. Tightening our stops will allow us to lock in more profit which is what I like to do when trading extended moves or if I think we will get a double top.
Silver SLV Trading Fund – Technical Analysis Trading
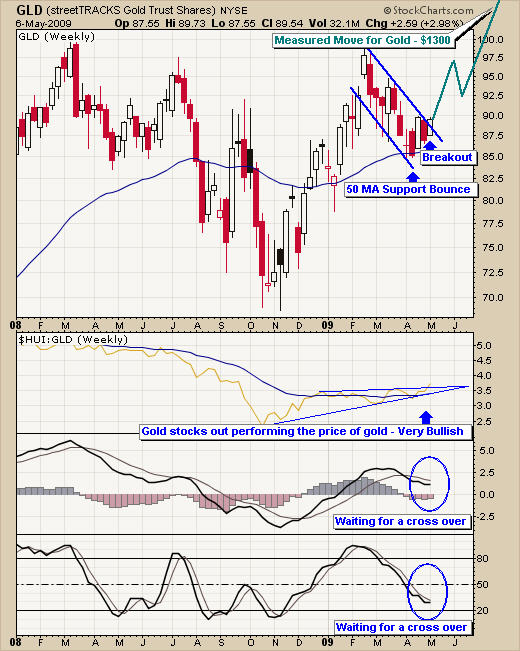
Gold Weekly Outlook & Technical Analysis
Gold is doing much the same as silver. The only real difference is that gold has already tested the high twice forming a potential double top. If gold prices hold up this week then I expect we will see new money move into gold with this bullish chart.
Gold had a $300 rally from the bottom in November, and if we see prices break out above the $1000 level, then the measured move for gold is $1300. Again this is calculated from the trading range (low in November to the high in February).
Gold GLD Trading Fund – Technical Analysis Trading
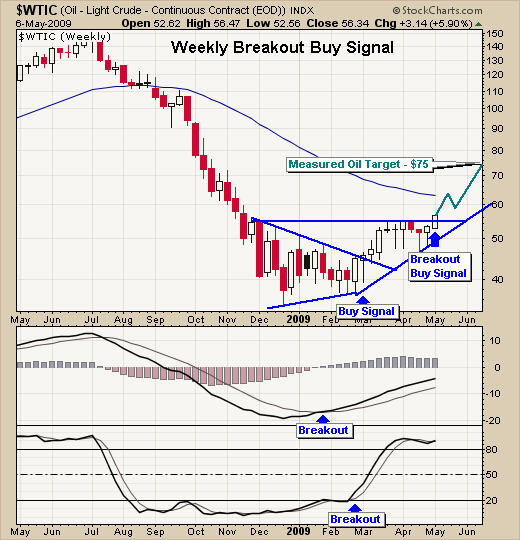
Crude Oil Weekly Outlook & Technical Analysis
Crude oil trading is a very hot topic and this weekly chart shows the beginning of a potentially massive rally which could send energy stocks through the roof again.
Oil formed a cup & handle pattern and broke out this week signaling a buy point for many traders. The upside measured move for this is the $75 area, but it could push even higher to the $90 level because the cup & handle pattern is one of the most powerful long term patterns. Oil has such a big following not to mention it’s extremely over sold after that crazy sell off the past 6 months, we should see money move into oil.
Crude Oil Trading – Technical Analysis Trading
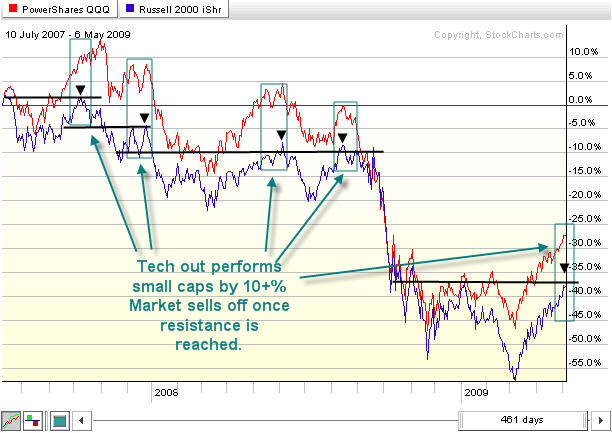
Broad Equities Market Weekly Outlook & Technical Analysis
I was playing with some charts today and stumbled across this interesting chart. I found that in a bear market when the QQQQ (tech stocks) are out performing the IWM (small caps) by 10+% the bear market rally rolls over and starts another leg down.
I thought the NASDAQ out performing everything else was unique this year, but when I looked back and noticed this happens near the top of every bear market rally it got me thinking.
After looking at the recent bear market I reviewed the last bull market from 2003. I noticed that the IWM (small caps) out perform tech in the same way during the bull markets. So when small cap stocks were 10+% above tech, the market would roll over and consolidate before rallying to make a new high again. Take a look at the chart below.
Broad Equities Market – Technical Analysis Trading
TheGoldAndOilGuy’s Trading Conclusion:
That being said the broad market in my opinion is way over bought and currently at resistance levels. Money is starting to move into precious metals and other commodities in anticipation of this over bought market.
Gold and silver both sold off a week before the broad market started is rally in March. The extreme over sold condition in equities was obvious to see by professionals locking in profits and buying stocks which are now up huge in the past 2 months. I think this is what we could be seeing now but in reverse.
Money is slowly rotating out of stocks and being put to work in precious metals and commodities. I will continue to update these trading charts every week.
If you would like more information on my trading model or to receive my Free Weekly Trading Reports - Click Here
I have put together a Recession Special package for yearly subscribers which is if you join for a year ($299) I will send you $300 FREE in gas, merchandise or grocery vouchers FREE which work with all gas stations, all grocery stores and over 100 different retail outlets in USA & Canada.
If you have any questions please feel free to send me an email. My passion is to help others and for us all to make money together with little down side risk.
To Your Financial Success,
By Chris Vermeulen
Chris@TheGoldAndOilGuy.com
Please visit my website for more information. http://www.TheGoldAndOilGuy.com
Chris Vermeulen is Founder of the popular trading site TheGoldAndOilGuy.com. There he shares his highly successful, low-risk trading method. For 6 years Chris has been a leader in teaching others to skillfully trade in gold, oil, and silver in both bull and bear markets. Subscribers to his service depend on Chris' uniquely consistent investment opportunities that carry exceptionally low risk and high return.
This article is intended solely for information purposes. The opinions are those of the author only. Please conduct further research and consult your financial advisor before making any investment/trading decision. No responsibility can be accepted for losses that may result as a consequence of trading on the basis of this analysis.
Chris Vermeulen Archive |
© 2005-2022 http://www.MarketOracle.co.uk - The Market Oracle is a FREE Daily Financial Markets Analysis & Forecasting online publication.
Comments
|
Ravi
14 May 09, 07:12 |
Silver price
I think the analysis is one potential. Potential for silver and gold reversing is high at this point. |