


Country Fund Portfolio Attributes Comparison
Stock-Markets / Investing 2009 Jun 17, 2009 - 08:24 AM GMTBy: Richard_Shaw

 Looking at country and region funds in terms of fundamental portfolio attributes, there are significant valuation differences which should be appreciated when making selections.
This chart presents key data from Morningstar for 45 country and region funds, and color codes the data in comparison to the total US stock market as represented by VTI.
Attributes of funds that are more favorable than the same attribute for the total US market are shaded green. Those less favorable are shaded pink, and those with an equal attribute value are shaded blue.
With respect to number of holdings and concentration of holdings, we acknowledge that there is opportunity to outperform a benchmark through a less diversified portfolio, however, for the purposes of this article greater diversification is deemed more favorable. Readers seeking concentration would just need to reverse the color meaning for those two dimensions to get the information they want.
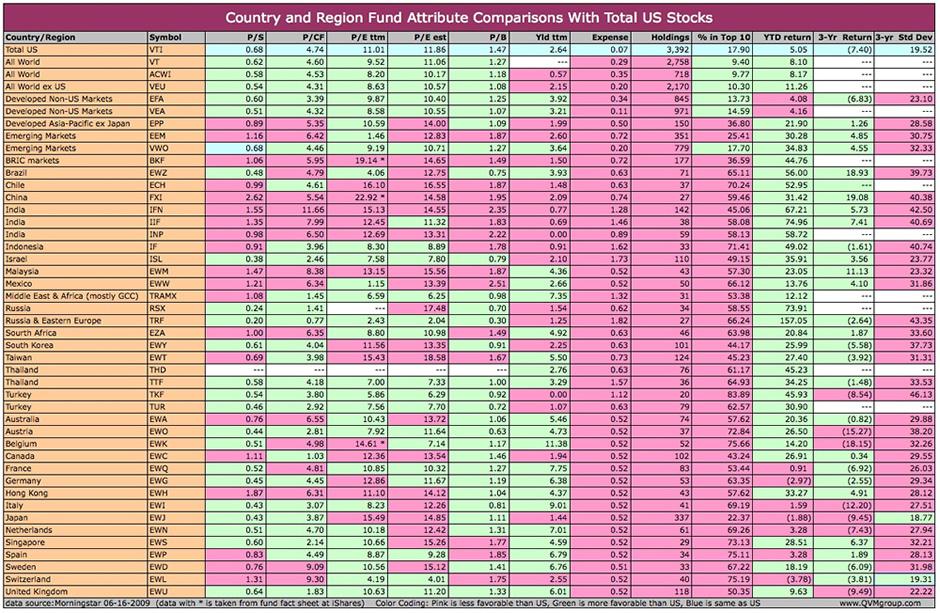
The funds in the list all have a higher expense ratios and fewer holdings than VTI (total US). Some have much higher expenses and many fewer holdings. It is important to understand that when you buy an index of a few dozen companies, you have more risk of a particular company driving results than if the portfolio has a few hundred (or even a few thousand) company holdings. Examples: FXI (China) and TRF (Russia and Eastern Europe) have only 27 holdings.
Similarly, funds with many holdings but large concentrations in a few holdings are driven more by single issue performance than funds without large concentrations. Examples: TKF (Turkey) has 83.89% of assets in the top ten holdings, and EWL (Switzerland) has 75.19% in the top ten holdings.
Most of the funds have higher 3-year total returns than the US, but also have higher 3-year standard deviation of return (volatility and range of returns). Examples: US had a -7.4% return with 19.5% standard deviation, whereas FXI (China) and EWZ (Brazil) have approximately 19% returns and approximately 40% standard deviations.
Emerging markets of all sorts have dramatically outperformed the total US stock market year-to-date, as have some developed markets, such as EWA (Australia), EWO (Austria), EWK (Belgium), EWH (Hong Kong), EWS (Singapore), and EWD (Sweden).
On a trailing yield basis, there are greater opportunities than the total US market, but when year-to-date return is considered the list is shortened to these that have a higher trailing yield and a higher YTD return: VWO (emerging markets), EWZ (Brazil) EWM (Malaysia), EWW (Mexico), TRAMX (Middle-East & Africa — mostly GCC), EZA (South Africa), EWT (Taiwan), THD and TTF (Thailand), EWA (Australia), EWO (Austria), EWK (Belgium), EWH (Hong Kong), EWS (Singapore), EWD (Sweden) and EWU (United Kingdom).
If you want better 3-year returns as well, these countries drop off the list: EWO (Austria), EWK (Belgium) and EWU (United Kingdom).
If you seek lower volatility as well as higher yield and YTD return, the list goes to none — with opportunity comes risk.
Funds with substantially more favorable price-to-sales and price-to-cash flow ratios with at least moderately more favorable forward P/E estimates are: ISL (Israel), TRF (Russia & Eastern Europe) and TUR (Turkey). Toss in geopolitical risk issues and the list goes to none.
Staying on top of portfolio attributes such as these may be helpful to you as part (but not all) of the information you consider about choices for your portfolio.
Note also that data sources often provide different information about the same thing — sometimes errors, sometimes differences in data definition. Checking more than one source and getting as close to primary sources as possible is important as you narrow your choices approaching a risk commitment decision.
By Richard Shaw
http://www.qvmgroup.com
Richard Shaw leads the QVM team as President of QVM Group. Richard has extensive investment industry experience including serving on the board of directors of two large investment management companies, including Aberdeen Asset Management (listed London Stock Exchange) and as a charter investor and director of Lending Tree ( download short professional profile ). He provides portfolio design and management services to individual and corporate clients. He also edits the QVM investment blog. His writings are generally republished by SeekingAlpha and Reuters and are linked to sites such as Kiplinger and Yahoo Finance and other sites. He is a 1970 graduate of Dartmouth College.
Copyright 2006-2009 by QVM Group LLC All rights reserved.
Disclaimer: The above is a matter of opinion and is not intended as investment advice. Information and analysis above are derived from sources and utilizing methods believed reliable, but we cannot accept responsibility for any trading losses you may incur as a result of this analysis. Do your own due diligence.
Richard Shaw Archive |
© 2005-2022 http://www.MarketOracle.co.uk - The Market Oracle is a FREE Daily Financial Markets Analysis & Forecasting online publication.