


Charting Perspective - Upward Wedge Puzzle - Index revealed and more on the Technology Sector
Stock-Markets / Tech Stocks Jul 19, 2009 - 05:31 PM GMTBy: Garry_Abeshouse

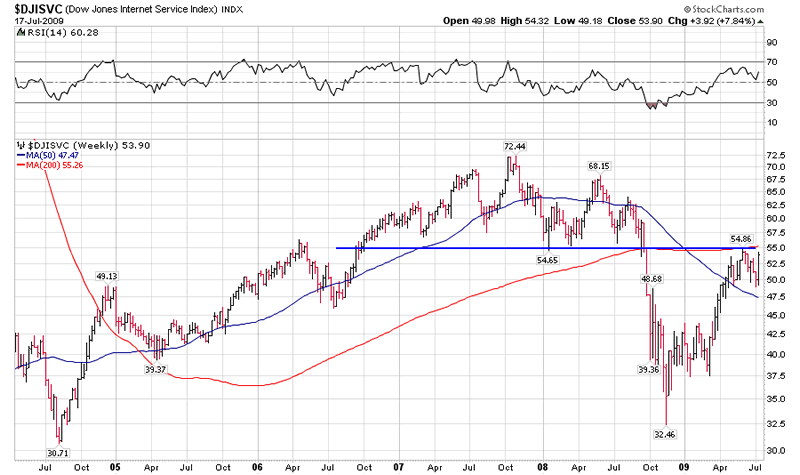
 On July 6th 2009 I posted a charting puzzle concerning a USA Index, where I said:
"This index represents one of the most important market sectors in the USA and as you can see, it has an interesting history.
The price patterns displayed are well defined and the upward wedges on the daily chart are typical of ones common at the moment over a broad spectrum of the USA equity market.
I would expect that whatever this index does in the near future, so will the rest of the market."
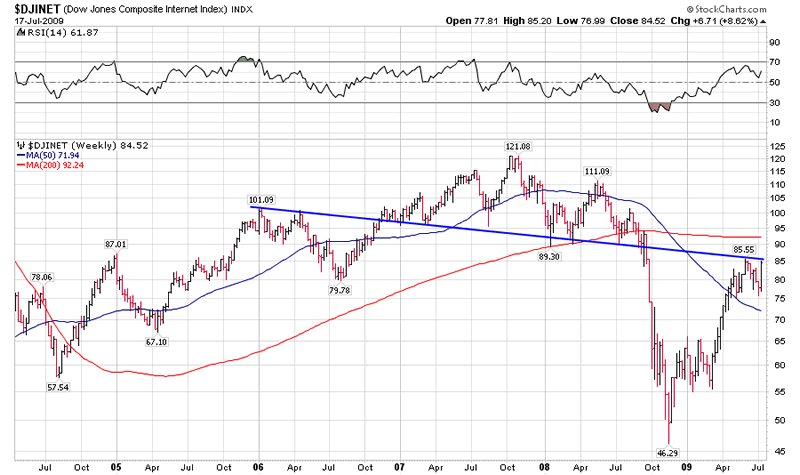
The charts shown were of the Dow Jones Internet Services Index, a lightweight subset of the Dow Jones Composite Internet Index, where:
"The Dow Jones Internet Composite Index is a blue-chip measure of Internet-related companies. It is made up of 40 stocks: 15 from the Internet
commerce sector and 25 from the Internet services sector. Only those companies that generate the majority of their revenues from the Internet
are eligible for inclusion, and stocks are selected to the index based on their rankings by size and liquidity. The rules for stock selection and
maintenance ensure that the index provides a consistent and accurate measure of the dynamic Internet industry over time." (Dow Jones)
Below is the updated weekly chart and below that, is its heavyweight parent chart. Both have well defined Head & Shoulder's tops, have fallen to their targets and have now pulled back to their necklines. Even a push above this level would leave many indexes and stocks at pricesnot seen since prior to September/October last year. What to then? Prices at higher levels such as these would leave stocks in an even more vulnerable position than they were before.
Think of throwing a ball up into the air. As it leaves your hand the energy of the throw sends it high into the sky. But the more it rises the less potential
energy it contains until it can rise no more. For an instant the ball stops in equilibrium with the force from the throw and gravity. Then gravity takes over
and the ball falls back to the ground.
In a similar way stocks have risen to such an extent that there is little energy left from the "throw". The resistance from the previous top, combined
with the declining volumes during the rise and the lack of economic "blue sky" will make a fall back to test the early 2009 support levels inevitable.
In the worst financial collapse the world has seen in nearly 80 years, how do you justify stock prices at similar levels to where they were prior to the
original collapse only nine months ago.
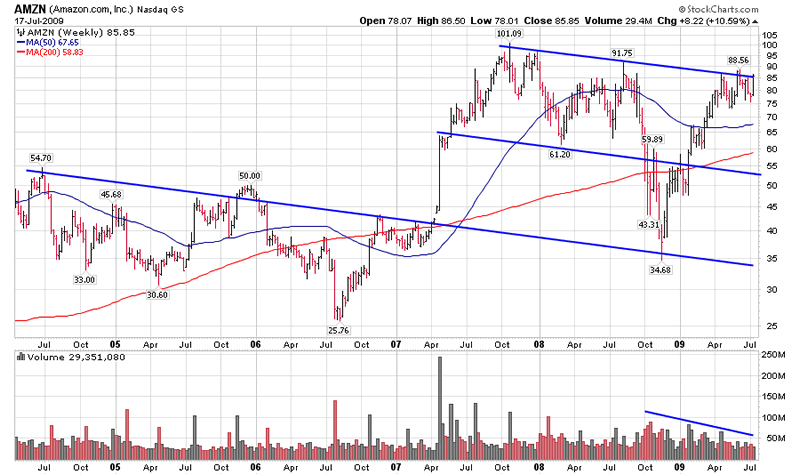
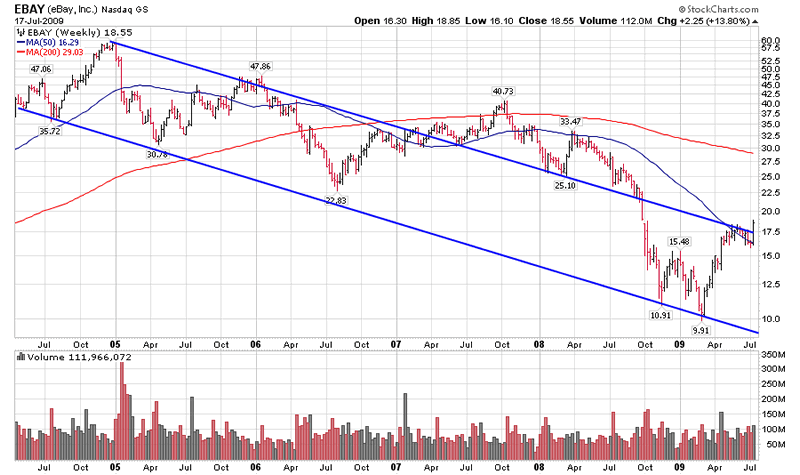
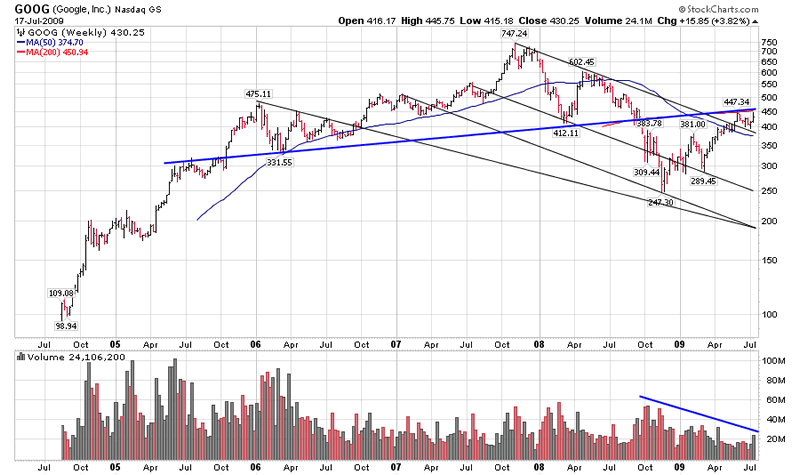
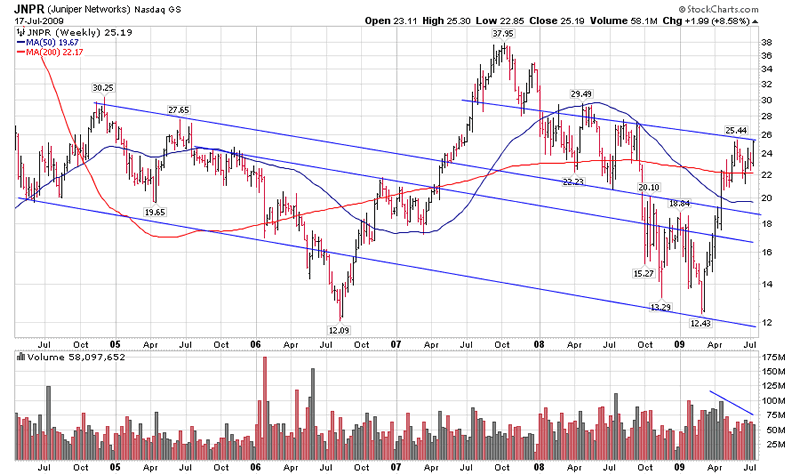
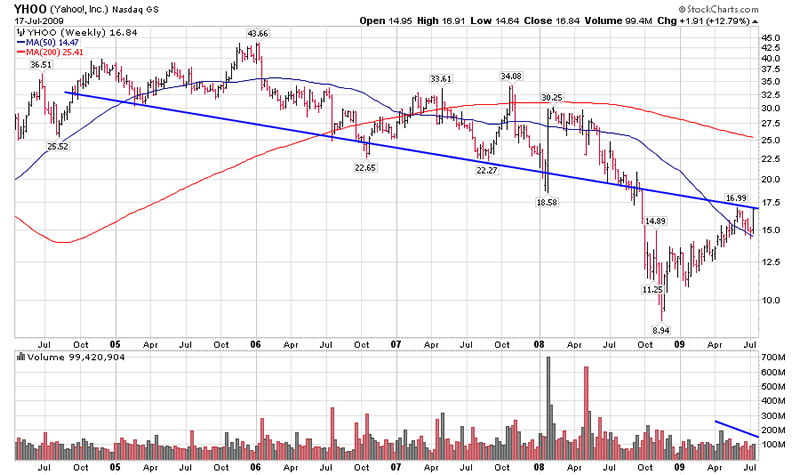
Five companies make up 33.35% of the Composite Index. These are Amazon, eBay, Google, Juniper and Yahoo.
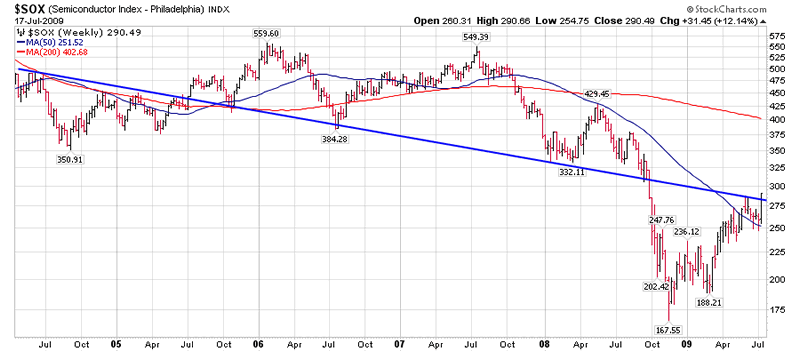
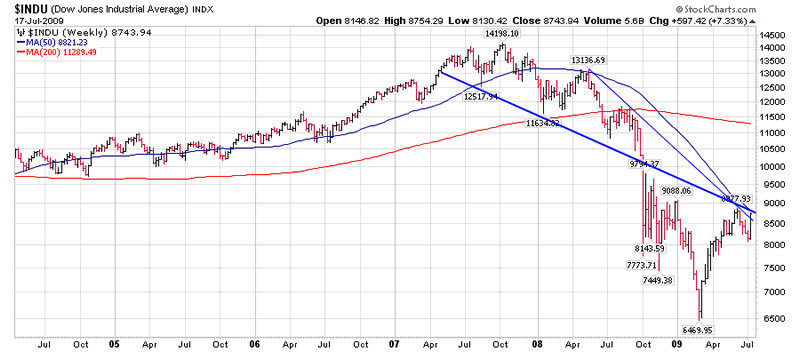
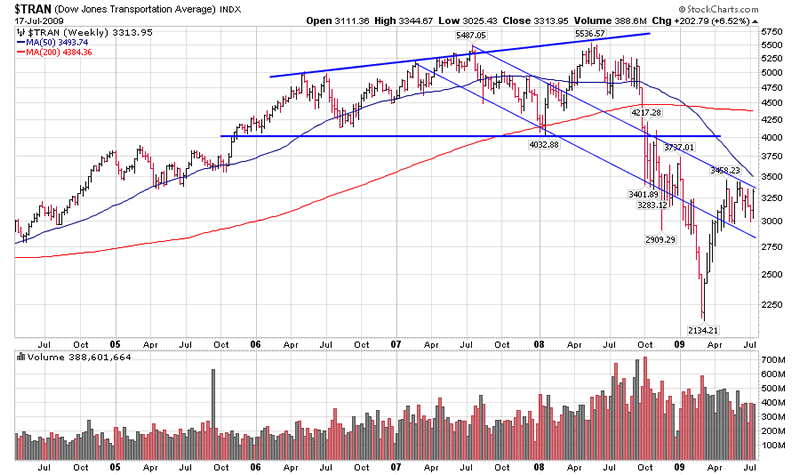
On each of the five charts below I have drawn what I feel to be is the most relevant support and resistance lines where available
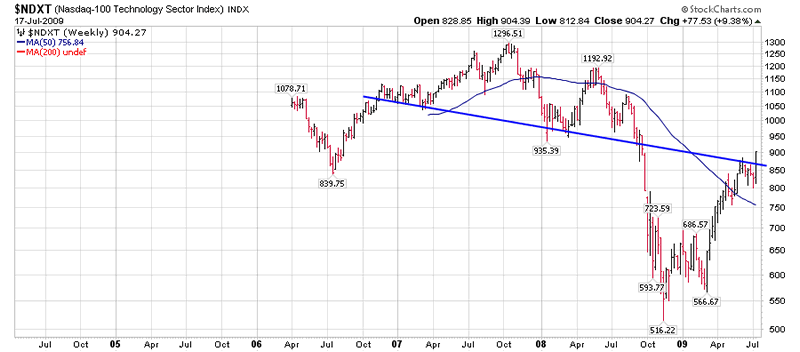
To complement the above charts and by way of comparison I have included two Technology indexes, two Composite indexes and a Transportation Index.
As you can see there is a quite a degree of conformity amongst the charts, with the pivot based axis lines highlighting the importance of the current technical position. The market has paused to consider its future at the top of an extended rally, highlighted by some market leaders in a variety of sectors rising to within a whisker of their all time highs. It is significant that all charts shown here are now consolidating BELOW key resistance lines rather than above. I consider this on its own to have bearish rather than bullish connotations.
The higher probability scenario is that his rally could fizzle in a couple of days or stretch out with a small rise and a further consolidation for a few more weeks, even to the end of October. The lower probability scenario is that the market could hang around around or just above where it is now until the end of the year. Either way I expect the bear market to continue and the lows to be tested.
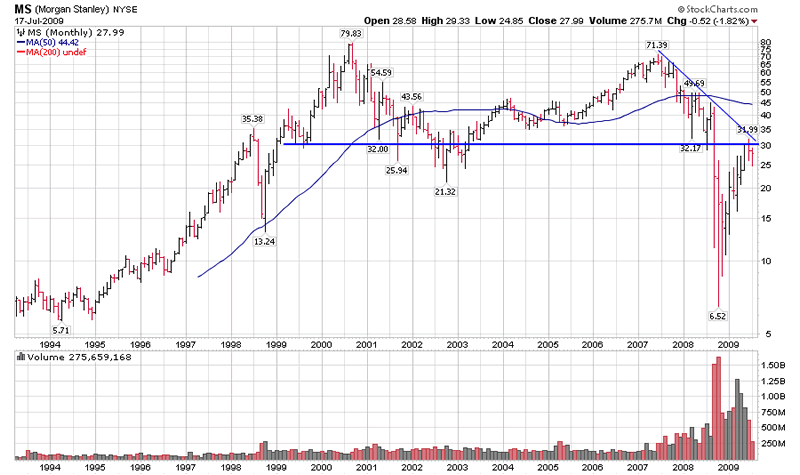
The monthly chart of Morgan Stanley shows very clearly what the Bulls in the finance and banking sectors are up against - a ten year double top, with the current price sitting just below the neckline. The banks are still the key to future movements in the market. This is the chart you should print out and blu tack to your wall or stick on your fridge. Any push through the neckline and downtrend over the next few weeks should be construed as a selling opportunity into a highly overbought bear market rally - rather than a sign that a new bull market is under way. The same
applies to the other charts illustrated above.
To me this chart of Morgan Stanley is a text book case and for me has become a key barometer for the whole market.
So watch this chart and keep it up todate.
Technology in Banking
As income from retail banking collapses, the large international banks are relying more and more on what they call "investment banking" to generate profits. In reality these banks are using newly created technology that has only been around for three or four years to trade the equity, currency and commodity markets. This technology, sourced from only a very small number of companies, utilises "ultra-high frequency algorithmic trading systems" as well as other algorithmic trading techniques to reduce the risk of trading losses and maximise profits. Much of this trading can actually be done anonymously and the companies advertising the software on the web promote this attribute as well as naming the banks who are their customers.
It is these techniques that have contributed significantly to the large trading profits recently announced by some of the largest banks.
But without the traditional retail banking base it remains to be seen whether they can continue to beat the odds over time and in a falling market, as well as surviving possible disasters resulting from human error, computer glitches or even deliberate sabotage. With trades worth tens of billions of dollars a month there is a lot at stake, so the mind boggles at what could happen in the future.
The really frightening aspect of this is that the bulk of this type of trading appears to be in the hands of only a small handful of banks and hedge funds.
So much power to make so much money in so few hands could even result in a finance bubble that, when it bursts, could take us all down with it.
Certainly something to think about or perhaps trying not to think about it. To read more see Link: http://www.marketoracle.co.uk/Article12104.html
Till next time.
Garry Abeshouse
Technical Analyst.
Sydney
Australia
I have been practicing Technical Analysis since 1969, learning the hard way during the Australian Mining Boom. I was Head Chartist with Bain & Co, (now Deutsch Bank)in the mid 1970's and am now working freelance. I am currently writing a series of articles for the international "Your Trading Edge" magazine entitled "Market Cycles and Technical Analysis".
I have always specialised in medium to long term market strategies and after discovering the excellent Point & Figure Charts from Stockcharts.com in mid 2008, have concentrated on this style of charting ever since.
© 2005-2022 http://www.MarketOracle.co.uk - The Market Oracle is a FREE Daily Financial Markets Analysis & Forecasting online publication.