


Charting the U.S. Recession Unemployment Crisis
Economics / Recession 2008 - 2010 Aug 06, 2009 - 12:33 PM GMTBy: Mike_Shedlock

 I have been following a number of unemployment charts showing just how bad the current recession is. Click on any chart to see a sharper image.
Job Loss Recovery
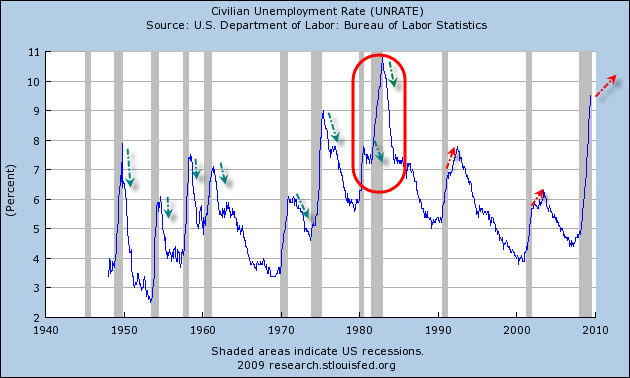
The last three recessions are unlike the eight preceding recessions. For numerous reasons described below we are heading for another job loss recovery.
Job Loss Recovery Detail
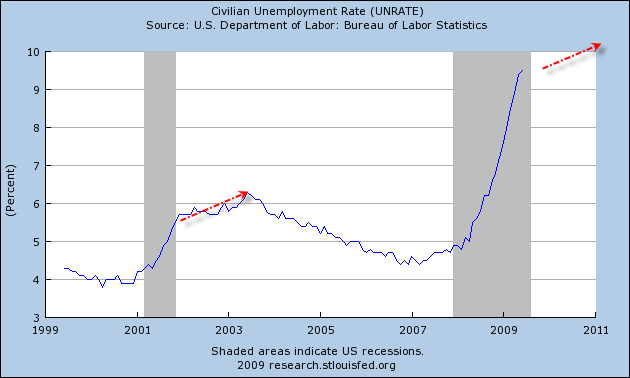
If the pattern holds, unemployment will rise until 2011 or beyond. Moreover, take a look at the first chart again. Odds of a double dip recession similar to 1980-1982 are high after whatever inventory rebuilding and bottom fishing in housing ends.
Consumer Confidence About Jobs
The Following is by permission from Contrary Investor
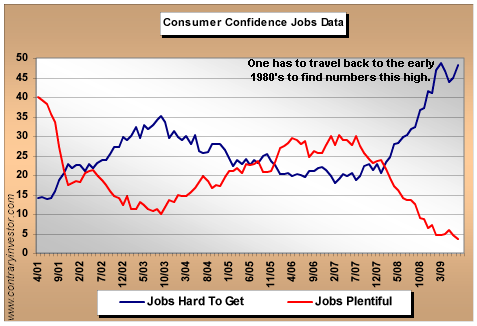
Contrary Investor writes:
"The jobs hard to get response is pushing up against 30 year highs seen in the last few months. Likewise the jobs easy to get component of the survey has hit a new low for the current cycle. We'll just have to see how hard the folks at the Bureau of Labor stats can goose the headline payroll numbers for July with further Birth/Death model estimates. We'll be surprised at nothing. But consumers are telling us labor market conditions have worsened, despite the government numbers. And without question this has driven their consumption behavior. "
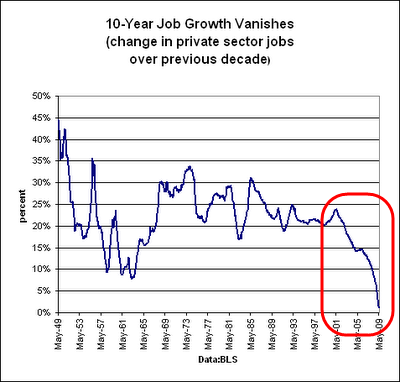
Decade For Lost Jobs
Please consider the following chart from Lost Decade For Jobs by Michael Mandel of BusinessWeek.
Record Number See Benefits End
The following chart is courtesy of David Rosenberg.
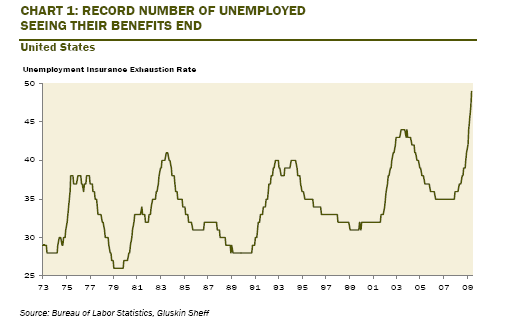
Take a good look at that chart. It's 50,000 now. The expectation is 500,000 by September and 1.5 million by the end of the year. What are the odds Obama creates 1.5 million jobs by the end of the year? Can he really create any? For how long?
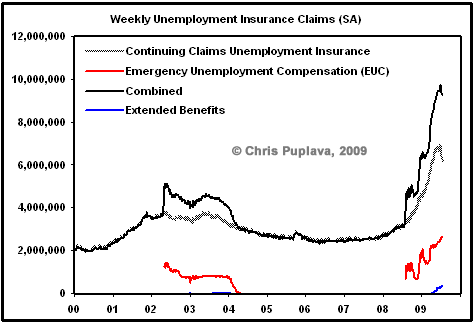
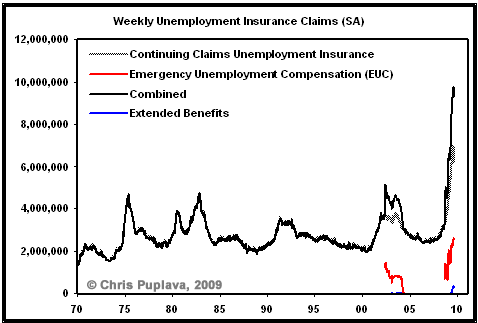
While on the subject of claims please consider the following four charts courtesy of Chris Puplava at Financial Sense. I asked him to chart Data from Moodys.
Continuing Claims Since 2000
Continuing Claims Since 1970
Continuing Claims as % of Population Since 2000
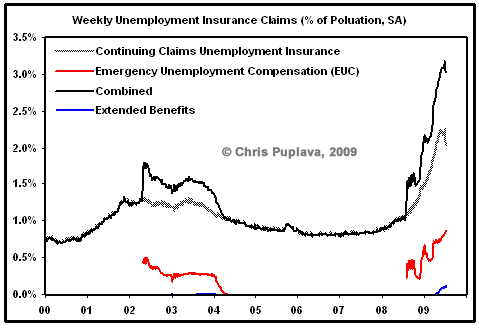
Continuing Claims as % of Population Since 1980
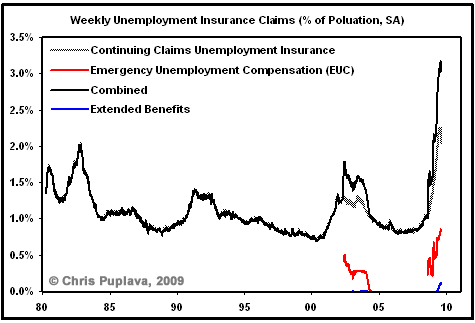
Chris notes "The EUC and the extended benefits come out with a lag as Moody’s had data for them only up to 07/11/09 while the continuing claims data is up to 07/18/09. The charts above are through 07/11/09."
I commented on the above series of charts in Weekly Unemployment Claims Portend Disaster.
Here is a snip.
Unparalleled Continuing Claims
On a percentage of population basis this recession is unparalleled.
Making matters worse, the US consumer was nowhere near as leveraged to real estate in 1980 or 1982 as now. Also note that boomers are heading into retirement now, undercapitalized and looking for jobs, in effect competing against their kids and grandkids for jobs.
Look at the average age of baggers in grocery stores or greeters at Walmart. These people are not working because they want to; they are working because they have to. Demand for jobs is at an all time high while the number of available jobs and the pay scales of those jobs have both collapsed. The employment situation is not only an unmitigated disaster, things are about to get worse with pending state cutbacks.
Because of expiring claims, continuing claims data will soon start looking better. The reality however, is things will get worse for another year as unemployment soars into double digits. My forecast in January was 10.8% in 2010 while the Fed's was 8.5%. I see no reason to change mine, but the Fed upped theirs.
The implications for housing and especially commercial real estate are ominous.
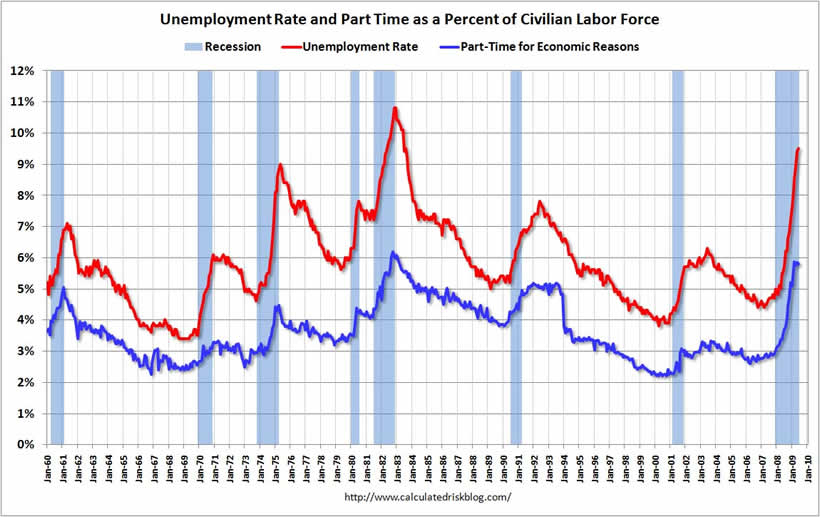
Part Time Employment
The following graph from Calculated Risk shows the unemployment rate and the percent of the civilian labor force that is working part time for economic reasons.
New figures come out on Friday but here is the June count of Part-Time Employment.
Table A-5 Part Time Status
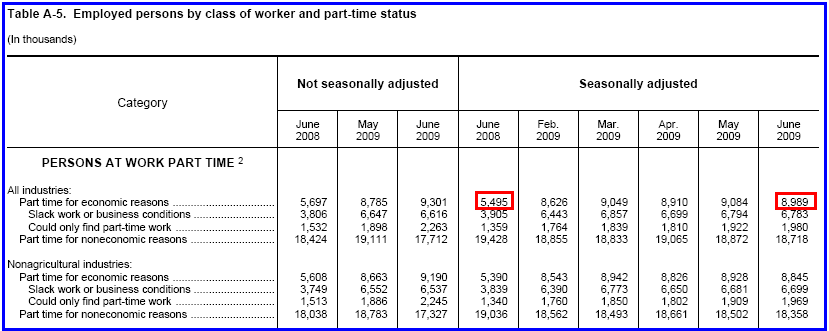
The chart shows there are 9 million people are working part time but want a full time job. A year ago the number was 5.5 million.
Exhausted Benefits
The following graph on the number of workers who have exhausted their regular benefits is also courtesy of Calculated Risk:
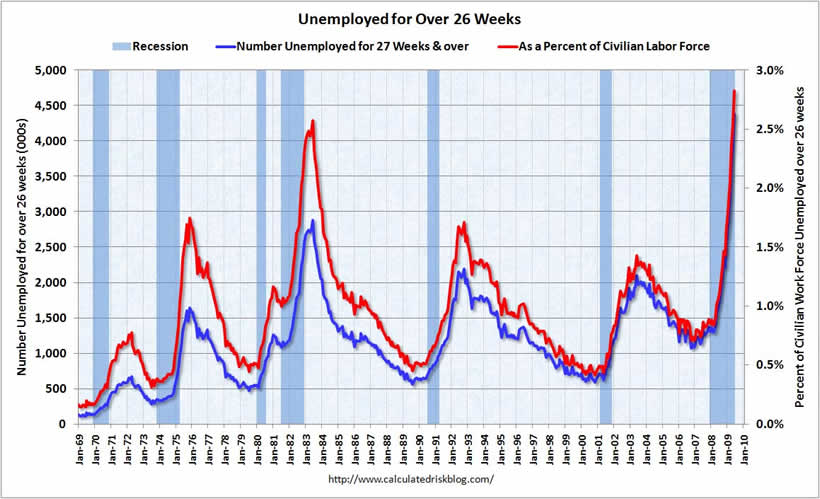
Calculated Risk writes:
"The blue line is the number of workers unemployed for 27 weeks or more. The red line is the same data as a percent of the civilian workforce. According to the BLS, there are almost 4.4 million workers who have been unemployed for more than 26 weeks (and still want a job). This is 2.8% of the civilian workforce.
Right now very few workers have exhausted their unemployment benefits, but there is tidal wave coming. The Law Project estimates 0.5 million workers will have exhausted their extended benefits by the end of September, and close to 1.5 million by the end of 2009. Unless the unemployment rate starts to decline, the numbers will continue to grow rapidly in 2010."
Incredible Shrinking Boomer Economy
Before many companies start hiring full-time workers, they will first put part-timers back to work full time. This will add significant delays to the hiring process in this "recovery".
Indeed, by the time "stimulus" wears out (and it will), the economy will be slipping back into a double-dip recession.
Note that there is no driver for jobs other than inventory replenishment and various stimulus measures. The latter does nothing but push demand forward. Meanwhile Wages and Salaries Fell 4.7%, Most On Record.
Finally, I want to leave you with a thought from the Incredible Shrinking Boomer Economy.
In his Town Hall Meetings Bernanke said:
"It takes GDP growth of about 2.5 percent to keep the jobless rate constant. But the Fed expects growth of only about 1 percent in the last six months of the year. So that's not enough to bring down the unemployment rate."
Inquiring minds might be asking: Why does it take 2.5% growth to keep the jobless rate constant? The answer is the first 2.5%+- of GDP is based on hedonics and imputations. In plain English, the first 2.5%+- of GDP (if not much more) is fictional. When the economy is growing at 2% it feels like a recession because it probably is, even though no one will admit it.
Now consider the implications of a 2.4% GDP forecast for three decades.
If Bernanke is correct that it takes 2.5% GDP growth just to keep the unemployment rate constant, and McKinsey is also correct in its 2.4% forecast, we will be stuck with 10% unemployment for decades.No Driver For Jobs
In the 1980's and 1990's an internet boom created massive numbers of jobs. Between 2000 and 2007 a housing boom created massive numbers of jobs. I keep asking what the next driver for jobs will be. Inventory replenishment will not do it. Nor will one-time stimulus efforts like road building.
Nothing on the energy front seems capable at this time of producing such a boom. Commercial real estate is massively overbuilt as is the retail sector. So don't look for Home Depot (HD), Lowes (LOW), Target (TGT), or Walmart (WMT) to lead the way. Forget about banking too as Citigroup (C), Wells Fargo (WFC), and Bank of America (BAC) have their hands full and then some.
And although one can never tell in advance when technology breakthroughs will happen, as we have seen, internment booms are not that common. In 2001 everyone was waiting for the next "killer app". Everyone is is still waiting so don't look at Intel (INTC), Microsoft (MSFT), or the technology sector either.
So while everyone is tooting horns and cheering the end of the end of the recession before it has even ended, those graphs and comments from Bernanke himself will put the pending job loss Recovery into better perspective.
By Mike "Mish" Shedlock
http://globaleconomicanalysis.blogspot.com
Click Here To Scroll Thru My Recent Post List
Mike Shedlock / Mish is a registered investment advisor representative for SitkaPacific Capital Management . Sitka Pacific is an asset management firm whose goal is strong performance and low volatility, regardless of market direction.
Visit Sitka Pacific's Account Management Page to learn more about wealth management and capital preservation strategies of Sitka Pacific.
I do weekly podcasts every Thursday on HoweStreet and a brief 7 minute segment on Saturday on CKNW AM 980 in Vancouver.
When not writing about stocks or the economy I spends a great deal of time on photography and in the garden. I have over 80 magazine and book cover credits. Some of my Wisconsin and gardening images can be seen at MichaelShedlock.com .
© 2009 Mike Shedlock, All Rights Reserved
Mike Shedlock Archive |
© 2005-2022 http://www.MarketOracle.co.uk - The Market Oracle is a FREE Daily Financial Markets Analysis & Forecasting online publication.