


Gold Marking Time Ahead of Inevitable Breakout
Commodities / Gold & Silver 2009 Aug 16, 2009 - 10:05 AM GMTBy: Merv_Burak

 Marking time. Moving sideways. Nothing to see here. Gold is getting really boring. It continues to move sideways inside that megaphone pattern. A break-out is inevitable, but when?
GOLD : VERY LONG TERM
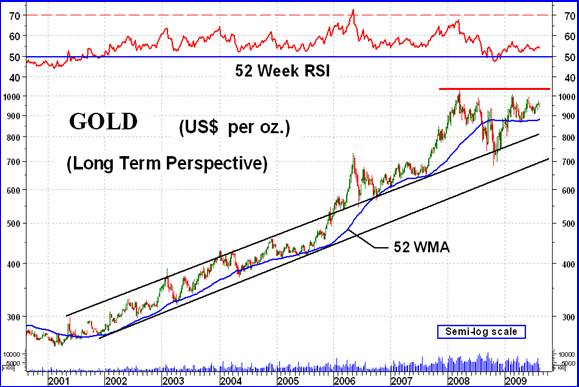
It’s instructive from time to time to look in on where we came from to better understand the possibilities as to where we might be going, or at least to assess the odds of going where we might want gold to go. The chart here is my very long term weekly chart of gold and includes a very long term 52 week simple moving average line and a very long term 52 week Relative Strength Index (RSI) indicator. Keeping it simple there are a few things one can decipher from this chart.
For the first five years of the bull market gold kept its activity within a tight up trending channel. In early 2006 it broke out of the channel on the up side. Now, when an established trend line is broken one can assume that a new more powerful trend is in progress. One can also be cautioned that the new more powerful trend could easily turn out to be a final bull market blow-off stage. It looked that way in early 2006 except that the RSI continued to make new highs suggesting the trend really had strength and was not just blowing off steam.
In mid-2007 gold took off again. This time it looked more like the blow-off stage one would have been watching for. The RSI was decidedly lacking in the same strength it had during the earlier 2006 move and in the end could not reach the same level even though gold itself went well into new highs. Although I have not shown it here, at the time I had mentioned my FAN PRINCIPLE trend lines and the creation of the third FAN trend line, the breaking of which was a blow-off reversal confirmation. The FAN trend lines are, first the original support line up to mid-2005. The second FAN trend line was from mid-2005 through the bottom in mid-2007. The final, blow-off FAN line was from the bottom of mid-2007 through the bottom in late 2007. This last third FAN trend line was broken on the down side in early 2008 above the $900 level and confirmed the blow-off was over. Now, two things could happen when a blow-off trend is finished. The price could go into a major bear market or the price could go into a lateral trend for a significant period of time. What we got was sort of a combination of the two.
So, from this very long term chart what can we expect now?
First, the blow-off top at $1034 remains a very strong resistance level and no new bull market can get going without this top being decisively broken. Second, although rallies may come they need to be accompanied by increasing strength on the up side for longevity. The rally from the late 2008 low to the early 2009 high WAS NOT on increasing strength and therefore could have been viewed as suspect. Although the price came very close to its previous high the RSI showed that the strength was very weak versus the strength of the previous move, which itself was weak versus the move in 2006.
Although gold is above its moving average line and the momentum is in its positive zone the price seems to be going nowhere right now. It needs to decisively break through that $1034 barrier. At this time that does not seem like the most likely scenario ahead.
LONG TERM
Let’s get back to more of the real world here. The long term P&F chart remains basically unchanged so we will forgo any additional comments here. The normal chart and indicators are still all basically positive. Gold remains above its positive sloping moving average line and the momentum indicator remains in its positive zone. The momentum has, however, dropped below its trigger line and the trigger has turned downward. The volume indicator is still quite strong and above its positive trigger line. All in all, the long term rating remains BULLISH.
INTERMEDIATE TERM
Because the gold price action has been in a basic lateral drift for several months we are very much in whip-saw territory, the frustration for a technician. From the intermediate term we had not been price whip-sawed but have been momentum whip-sawed. The price is still just above its positive moving average line and the momentum indicator is still in its positive zone but the momentum has once more crossed its trigger line to the down side and the trigger has followed with a turn downward. The volume indicator is still the strong indicator and remains well above its positive trigger line. As mentioned above, the action remains in that megaphone mentioned in previous commentaries. Despite some weakness coming into play the rating remains BULLISH for now.
SHORT TERM
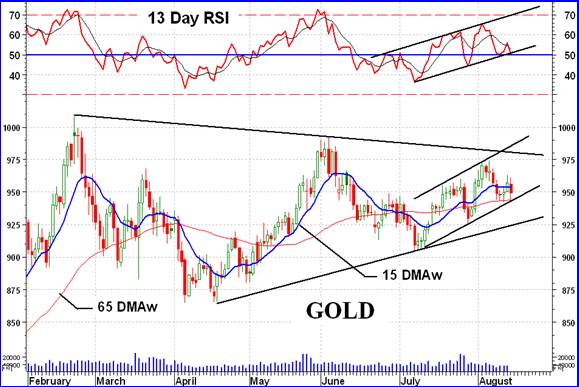
The lateral drift in the price of gold is affecting the short term indicators as it does the intermediate term. This past week we had the price move below, then above and finally below its moving average line. The line slope ended the week slightly on the down side. As for the short term momentum indicator, it stayed in its positive zone all week and finished just above its neutral line. It has ended the week below its trigger line and the trigger slope remained negative throughout the week. As for the daily volume action, it remained basically low all week. I know that there is a cycle to the volume activity. This can be seen by the peaks every two months but still one would like to see better volume action, especially on the upside days. The short term rating has once more gone to the BEARISH position.
As for the direction of least resistance, that’s a tough one. The Stochastic Oscillator has just moved above its oversold line and above its positive trigger line. This often (but not always) denotes a strengthening in the price action, so I think I’ll go with the up side although that does not look like the right side to be on.
SILVER
Everything lately seems to suggest that silver is where the action is, not in gold. The Table below shows silver as being one of the few winners this past week. It is showing as number two in short term performance being beaten out only by the Merv’s Qual-Silver Index which is number one. Its performance versus gold in the intermediate and long term has shown a positive change and it now has a slightly better performance in those time periods versus gold, which is a reverse situation from the past many months.
Silver price remains above all three of its moving average lines (short, intermediate and long term) and all three moving averages are sloping in the positive direction. Also, all three momentum indicators remain in their positive zones. The volume indicator continues its move in new high territory for one of the best positive indicators. All in all, silver rating is BULLISH for all three time periods.
PRECIOUS METAL STOCKS
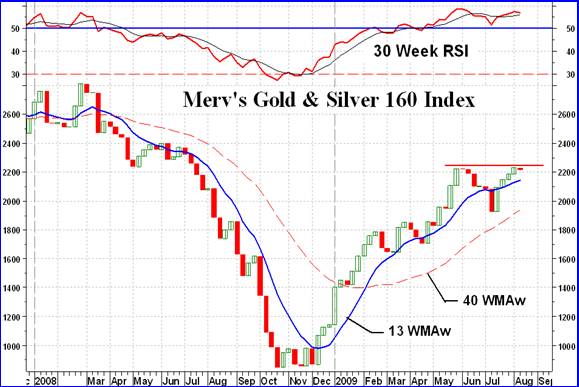
Based upon average weekly performance of the 160 stocks represented in the Merv’s Gold & Silver Index the Index rose from its low of 42.27 in 1998 up to its all time high of 2812 in late 2007 (a better than 6550% move). After several months of sideways movement and an attempt to break into new highs the Index took a tumble and fell all the way back to the 845.75 level. That was a bear move of 70% in one year. Still it was 1900% above its starting point. Since the bottom the Index has advanced 162%. Unfortunately, it looks like the advance is running into trouble. We have what one could call a double top and we need a good advance from here to negate that. If we don’t soon get a new advance in these stocks we could see a quick 30% move in the wrong direction.
Almost everything was lower this past week but it wasn’t as bad as it looks. Although the major North American Indices dropped some 2.0% the average stock actually dropped only 0.6%, only a minor drop. Still more encouraging is the Penny Arcade Index, which declined only 0.5%. As long as this Index is not plunging in a bear market the majority of stocks will still look okay.
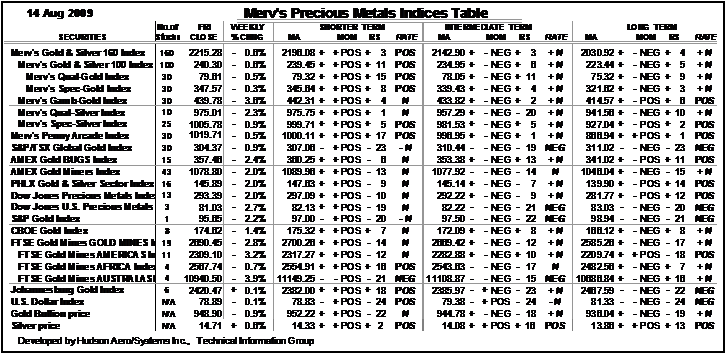
MERV’S PRECIOUS METALS INDICES TABLE
Well, that will be it for this week.
By Merv Burak, CMT
Hudson Aero/Systems Inc.
Technical Information Group
for Merv's Precious Metals Central
For DAILY Uranium stock commentary and WEEKLY Uranium market update check out my new Technically Uranium with Merv blog at http://techuranium.blogspot.com .
During the day Merv practices his engineering profession as a Consulting Aerospace Engineer. Once the sun goes down and night descends upon the earth Merv dons his other hat as a Chartered Market Technician ( CMT ) and tries to decipher what's going on in the securities markets. As an underground surveyor in the gold mines of Canada 's Northwest Territories in his youth, Merv has a soft spot for the gold industry and has developed several Gold Indices reflecting different aspects of the industry. As a basically lazy individual Merv's driving focus is to KEEP IT SIMPLE .
To find out more about Merv's various Gold Indices and component stocks, please visit http://preciousmetalscentral.com . There you will find samples of the Indices and their component stocks plus other publications of interest to gold investors.
Before you invest, Always check your market timing with a Qualified Professional Market Technician
Merv Burak Archive |
© 2005-2022 http://www.MarketOracle.co.uk - The Market Oracle is a FREE Daily Financial Markets Analysis & Forecasting online publication.