


Gold, Recessions, Bonds, and 1987 Stock Market Crash
Stock-Markets / Financial Markets 2009 Oct 09, 2009 - 12:37 PM GMTBy: Chris_Ciovacco

 As investors try to make sense out the of relentless bullish moves in asset prices, we’ll touch on a few timely topics:
- What signal is gold possibly sending?
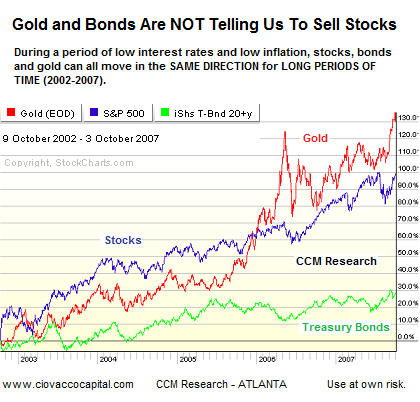
- Are bonds and gold telling us to sell stocks?
- How have stocks behaved historically after the end of a recession?
- Are stocks about to crash like 1987?
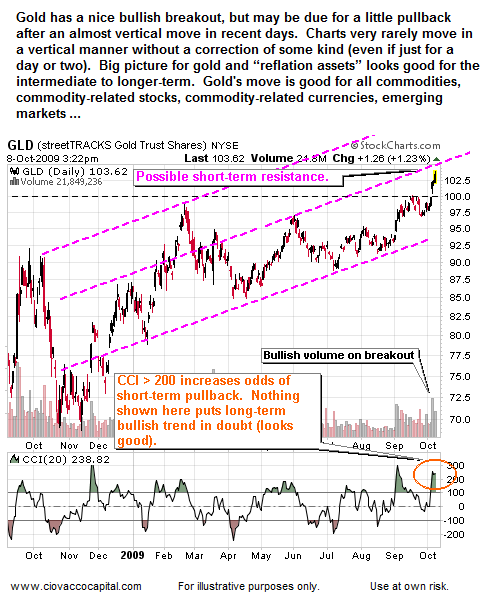
Gold's Move Supports Higher Asset Prices
After failing to do so since March 2008, gold finally was able to break the 1,034 barrier this week. If you want stocks and commodities to go higher, then you want gold to go higher as well. Why? Because a major objective of all the money printing, government intervention, and low interest rates is to create positive inflation, which includes asset price inflation. Asset inflation helps heal sick balance sheets and repairs a portion of the lost "wealth effect". When gold lies dormant, it means reflation is not working all that well in the minds of market participants. Gold’s recent breakout may indicate that the entire reflation of assets is working (in the minds of market participants - they fear future inflation caused by money printing, intervention, etc.). Asset prices need positive inflation (rather than deflation) to move higher. Risk/weak dollar/reflation assets need gold to move – it is – and that is a good sign for most markets.
Chart 1
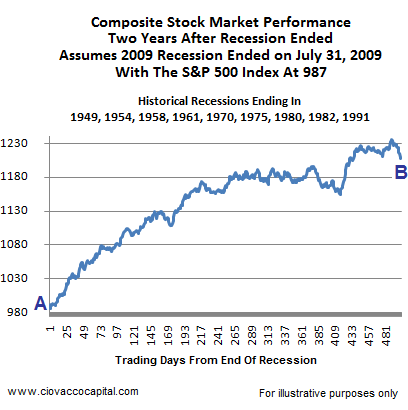
Stock Market Performance After Recessions On September 15, 2009, Federal Reserve Chairman Ben Bernanke said the current recession is "very likely over." What Chairman Bernanke is referring to is the end of the "GDP recession", which means we could be seeing positive GDP numbers from the current quarter. It does not mean everyone has a job, job security, and generally feels good about the future. The analysis below is based on the end of a "GDP recession", which probably occurred sometime in July 2009. Regardless of how people felt in 1949, 1954, 1958, 1961, 1970, 1975, 1980, 1982, and 1991, the average path stocks took in the two years following a recession’s end was quite positive (see Chart 2 below). In 2009, this tells us odds favor higher stock prices in two years. Whether or not that happens remains to be seen, but the charts remain in a bull market as of the close on Thursday, October 8, 2009.
As depicted in Chart 2, the two-year period following the end of recessions tends to produce favorable investment outcomes for investors. In nine out of the last ten cycles when recessions came to an end, the stock market had already climbed above its 200-day moving average giving technical confirmation to an improving fundamental outlook (the exception was 2001). Point B in Chart 2 would hypothetically occur in July of 2011. Point A corresponds to July 31, 2009 (hypothetical end of recession). Chart 2 shows the mass psychology of investors as they shift from fear (during the recession) to greed (after the recession).
Chart 2: Shift In Mass Psychology
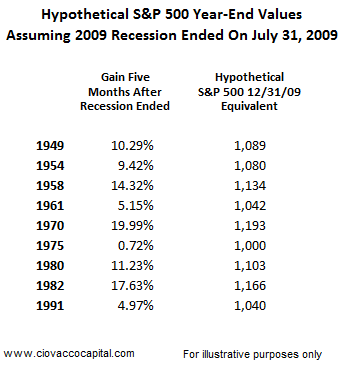
With 2009 year-end approaching fast, Table 1 shows the market’s performance during the first five months following the end of a recession. If we assume the 2009 recession ended on July 31, 2009, five months would correspond with December 31, 2009.
Table 1
1987: Not Very Similar To 2009
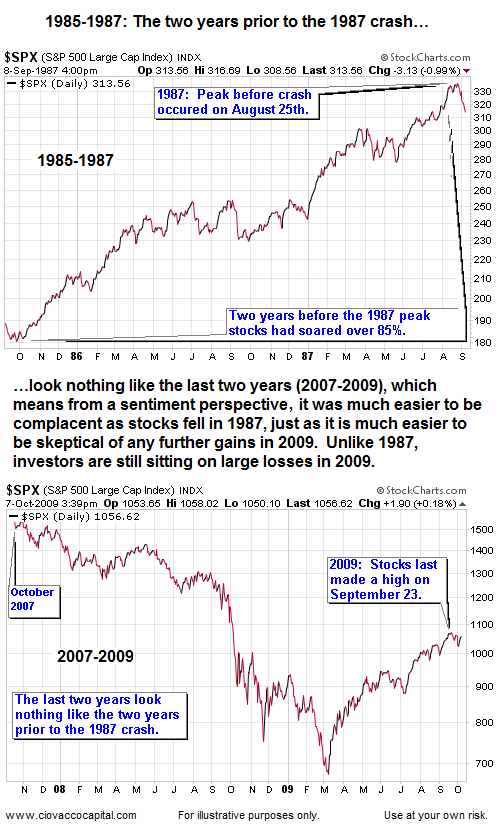
While no one can predict the future, we can study the past in order to get a better understanding of how greed and fear can impact financial markets. People have been greedy and fearful since the beginning of time, which means they tend to act in similar ways from generation to generation. Many market observers are saying stocks are about to crash in 2009. We have studied every bull and bear market cycle since 1929. We see very little reason to believe that a stock market crash is imminent, based on what we know as of October 8, 2009. However, it never hurts to examine bearish turns since we may learn something that may help us spot trouble in the future.We have covered other bull and bear cycles in previous articles and in CCM research publications. We have not previously covered 1987 since it does not compare well to the present day. When stocks made lows in early March 2009, a serious and painful "waterfall" bear market had just ended. Therefore historical cases of investor's reactions after "waterfall" bear markets best capture the circumstances of investor greed and fear as it relates to the present day. As shown below, investor’s level of confidence was quite different in October of 1987 after two years of gains vs. today where going two years back buy-and-hold investors are still sitting on big losses. Sentiment is a big driver of investors' actions.
Charts A & B
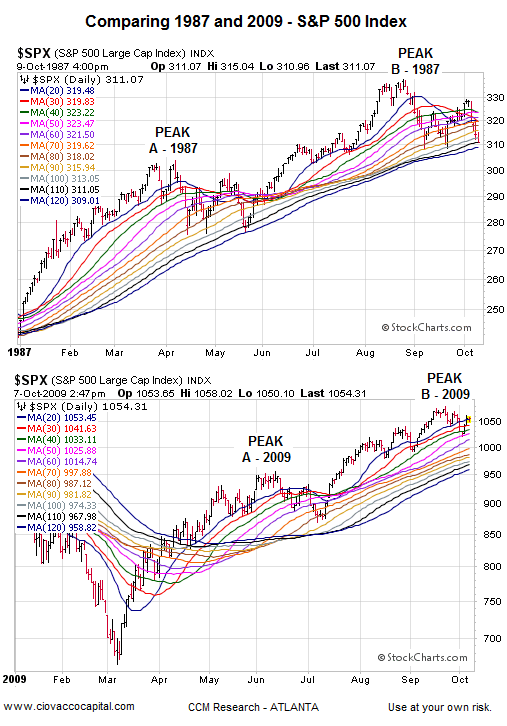
While quite busy-looking, the moving averages in the charts below can help us better understand the potential staying power of a market’s trend. In 1987, stocks experienced a significant correction between late March 1987 and late May 1987 (see Peak A-1987 in Chart C below). Peak B-1987 turned out to be the last hurrah before the crash. We have shown recent peaks in 2009 for comparison purposes (Chart D below). Our focus is on how the moving averages interact with each other and how they interact with price. Chart D is as of October 7, 2009.
Charts C & D
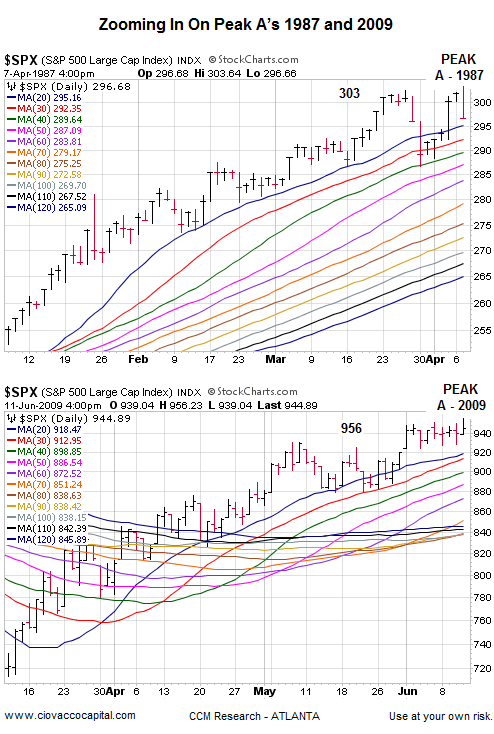
Below (Charts E & F), we are zooming in on Peak A in 1987 and on Peak A in 2009. The moving averages in the Peak A -1987 graph show an extended market that looks due for a correction. Peak A in 2009 does not look similar to the extended state of Peak A in 1987. Peak A in 2009 occurred in June only three months after a “waterfall” bear market – hence the market was not nearly as stretched as it was in April of 1987, when Peak A-1987 occurred.
Charts E & F
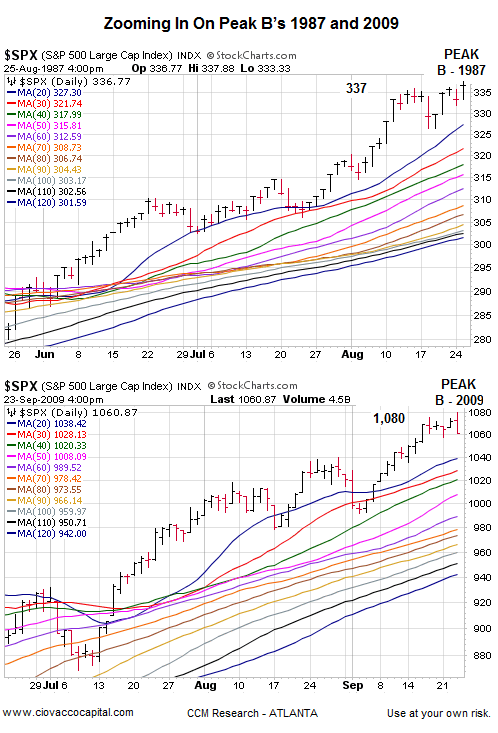
Peak B-1987 (Chart G below) also shows an extended market – note sharp rise of the 20 and 30-day moving averages (blue and red lines in top graph / Chart G). Peak B-2009 (Chart H below) also represents an extended market, which did ultimately lead to a correction. However, the distance between the 20, 30, and 40-day moving averages (blue, red, and green lines in 2nd graph below) is more compact, representing a market which was a little tamer compared to Peak B-1987.
Charts G & H
1987: Technicals Did Raise Some Red Flags
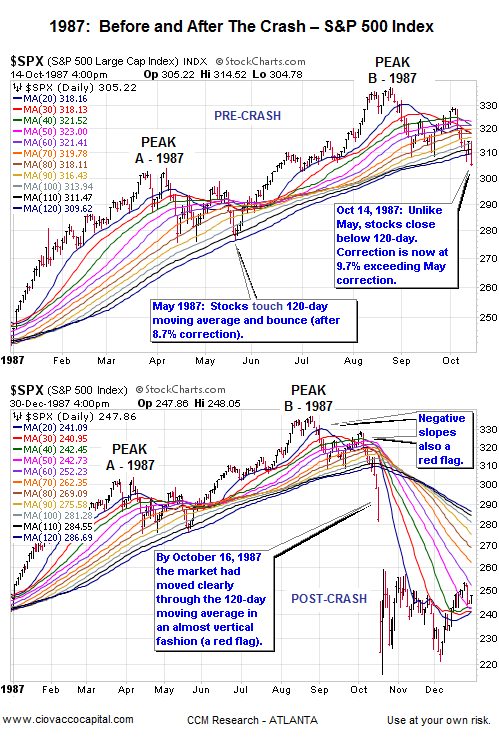
The two charts (I & J) below show 1987 pre-crash (top) and post-crash (bottom). On Peak B-1987 notice how the 20-day (blue) pulled away from the 30-day (red) and then broke back down sharply (steeper slope than Peak A-1987). When looking for signs of something more than a correction within a normal uptrend, you look for something that has not happened before (such as a break of the 120-day and a larger percentage decline - see notes on Charts I & J below). The differences can be triggers to start controlling risk (a.k.a. doing some selling). The worse it gets and the further it moves outside the realm of a normal correction, the more you should sell. Sharp declines (almost vertical) warrant more selling. You can make better decisions by studying recent corrections in the market. If the current correction looks like recent corrections, you can stay the course.
Charts I & J
Markets Remain Bullish, But Need To Be Monitored
The technicals (charts) and fundamentals (improving economic data, post recession history, gold's move, etc.) continue to favor the bulls. Until we see technical evidence to the contrary, we will assume we will get more of the same - bullish outcomes and higher highs. As always, we need to be ready to play defense should conditions change. "Monitoring The Health Of The Bull - Red Flags", which acknowledges the risks associated with blind investments in the current environment, can help you with some possible red flags to look for (see Page 20 of the most recent Asset Class Outlook.) Many problems remain.
Investments or strategies described above may be inappropriate for some investors based on their own individual situation and risk tolerance.
By Chris Ciovacco
Ciovacco Capital Management
Copyright (C) 2009 Ciovacco Capital Management, LLC All Rights Reserved.
Chris Ciovacco is the Chief Investment Officer for Ciovacco Capital Management, LLC. More on the web at www.ciovaccocapital.com
Ciovacco Capital Management, LLC is an independent money management firm based in Atlanta, Georgia. As a registered investment advisor, CCM helps individual investors, large & small; achieve improved investment results via independent research and globally diversified investment portfolios. Since we are a fee-based firm, our only objective is to help you protect and grow your assets. Our long-term, theme-oriented, buy-and-hold approach allows for portfolio rebalancing from time to time to adjust to new opportunities or changing market conditions. When looking at money managers in Atlanta, take a hard look at CCM.
All material presented herein is believed to be reliable but we cannot attest to its accuracy. Investment recommendations may change and readers are urged to check with their investment counselors and tax advisors before making any investment decisions. Opinions expressed in these reports may change without prior notice. This memorandum is based on information available to the public. No representation is made that it is accurate or complete. This memorandum is not an offer to buy or sell or a solicitation of an offer to buy or sell the securities mentioned. The investments discussed or recommended in this report may be unsuitable for investors depending on their specific investment objectives and financial position. Past performance is not necessarily a guide to future performance. The price or value of the investments to which this report relates, either directly or indirectly, may fall or rise against the interest of investors. All prices and yields contained in this report are subject to change without notice. This information is based on hypothetical assumptions and is intended for illustrative purposes only. THERE ARE NO WARRANTIES, EXPRESSED OR IMPLIED, AS TO ACCURACY, COMPLETENESS, OR RESULTS OBTAINED FROM ANY INFORMATION CONTAINED IN THIS ARTICLE. PAST PERFORMANCE DOES NOT GUARANTEE FUTURE RESULTS.
Chris Ciovacco Archive |
© 2005-2022 http://www.MarketOracle.co.uk - The Market Oracle is a FREE Daily Financial Markets Analysis & Forecasting online publication.