


Stock Market Short-term Reversal Assured
Stock-Markets / Stock Index Trading Oct 11, 2009 - 06:46 PM GMTBy: Andre_Gratian

 Current Position of the Market
SPX: Long-term trend - Down! The very-long-term cycles have taken over and if they make their lows when expected, the bear market which started in October 2007 should continue until 2014. This would imply that much lower prices lie ahead. This will not be a straight-down decline, but a series of intermediate-term rallies and declines until we have reached the low point.
SPX: Intermediate trend - The intermediate move which started in March may be coming to an end, but signals are mixed. It is possible that we will end up with just a correction in an uptrend.
Analysis of the short-term trend is done on a daily basis with the help of hourly charts. It is an important adjunct to the analysis of daily and weekly charts which determines the course of longer market trends.
Daily market analysis of the short term trend is reserved for subscribers. If you would like to sign up for a FREE 4-week trial period of daily comments, please let me know at ajg@cybertrails.com .
Overview:
Are we going to make a new high next week, or will 1080 remain the high of the rally from the March low? Perhaps neither! A top is very near, and it could have been made on Friday, but what kind of a top? That will be for the market to answer as time goes by. The short-term sentiment indicator is negative, but the longterm one is only neutral! I am not sure that we can have an intermediate term top with this kind of neutral reading. The same ambiguity is expressed by other sentiment readings.
The 22-wk cycle inversion will serve as the catalyst for the top. It is ideally due to make its high on Monday, but could have made it on Friday. Friday is the 22nd week, but counting 108 days from the end of the last phase brings you to Monday. Indicators and structure are poised for a decline which some analysts think could be very important. We'll see! First, the correction will have to go beyond 992. If it does, then we might have a chance of turning the coming decline into something larger. The last time the cycle inverted, it produced a decline of 51 points before the rally resumed. A similar decline would not bring the SPX below 992, but we are more overbought than we were then, and some of the recent economic reports have been less than stellar, with unemployment continuing to climb, suggesting that the "recovery" may be slowing down. The longer term cycles "should" have turned down by now for a bottom in 2010, but have been delayed by signs of an economic recovery. They could be delayed some more!
Some ellioticians had already called 1080 the top of primary wave 2. The problem is that the rally from 1020 has cast doubt on that labeling and, unless we are currently making a truncated wave 5 to finish P2 , we may have only a moderate correction followed by higher prices later in the year. And by then, we could find out that we have been making a different pattern entirely -- not uncommon in Elliott Wave analysis.
One analyst who expects a sharp reversal in this time period is Chris Carolan, who publishes The Lunar Calendar. Since the market indicators and the cyclic configuration tend to agree with his forecast, we should be ready for some sort of correction, perhaps a sharp one. We can decide later on if it is the beginning of a major decline.
What's ahead?
Chart Pattern and Momentum
Patience is one of the most important virtues that an analyst can possess. He must learn to wait until his indicators get in the correct position before he can make a decisive market call. Since it resumed its uptrend in July, we have been waiting for the SPX to tell us that it is coming to the end of its trend. Finally, the Weekly chart indicators are saying that the index may be close to a significant reversal. Last week's rally has all the makings of being a failed attempt at reaching new highs. This will be much easier to spot on the daily and hourly charts.
Last week is also 22 weeks from the last inversion of the 22-wk cycle, and it brings about another one. An inversion in this cycle is capable of producing a decline of several weeks.
You can also see that the indicators are exhibiting plenty of negative divergence. The lines of the MSO (below) crossed last week and could only make a feeble attempt at reversing in spite of this week's strong rally. All we now need is for the index to turn down once more. There is a very good chance that if it does, it will continue down and break through its green uptrend line. That does not mean that this reversal will necessarily extend to a new low.
On the Daily chart (below) day #108 will be Monday. The most pronounced divergence is shown by the MACD, which broke its uptrend line last week. That trend line matches the lower trend line of the rising market wedge and makes the divergence even more compelling.
The index tried several times to go back through the broken trend line from underneath, but was stopped on every attempt. With the 22-wk cycle ready to reverse, it has run out of time and the odds are that it will not make a new high and 1080 should remain the high of the move.
The last 4-year cycle bottomed in 2006. That would place the next 4-year cycle next year and we are well past its mid-point. Purely from that perspective, we could be at the top of that cycle and at the beginning of its final phase downward.
Next, we'll look at the Hourly chart. The vertical red line is where the current phase of the 13-day cycle is expected to end. Should it be a low, we will have some weakness at the opening on Monday, followed by a little rally. If, instead, we open higher, it will mean that the 13-day cycle is probably inverting also. Whatever happens at the beginning of trading, we cannot sustain an up-move for very long. All the indicators are showing negative divergence, and the worst one is the A/D at the bottom. Their lines have already crossed and they were not able to cross again to the upside during that last little uptrend -- a sign of weakness.
The index has already broken outside of its short-term trend line, and is moving up in a small wedge-like pattern that ended the day at a slightly new high. All we have to do is to break the small bottom trend line to start a downtrend. We could find some immediate support on the MAs, 10 to 15 points lower, and after those are broken, we most likely will have started our decline. If we push a little higher at the opening, it could be a very brief affair.
Since the beginning of the rally from 1020, volume has been very light -- much lighter than during the previous decline from 1080, and Friday's volume was the lightest. Not a positive sign!
Cycles
We've already discussed cycles to some extent, from the beginning of the letter. The one that matters most at present is the 22-wk cycle which, on Monday, will have reached day #108 of a 108-day cycle. Since the cycle has inverted, its reversal will be on the downside. If it lengthens its phase by a day or two, it would give us a chance to make a new high. It could happen, but considering the total technical picture, it is not expected.
Projections:
The original projection before the SPX reversed from 1020 was 1080-1085. It is conceivable that we could push to 1085 if there is a little show of strength on Monday.
1074 was a target left standing on Friday and would be more reasonable for an ending climactic spike. Since anything is possible, should we move beyond those levels, the next target would be 1095, and then 1109.
If we should start to decline immediately on Monday morning and get past the MAs of the hourly chart, we could find our first support at about 995. Going beyond 992 would bring us to about 947. If it is shown that we have started a very serious decline, I'll give some lower projections a little later.
Breadth
The NYSE Summation index (courtesy of StockCharts) continues to depict a topping formation, with the last 50-point rally of the S&P not even registering on the index. This is bearish! Any decline in the S&P would take the pattern to a lower low. The RSI has already done it even though we've been in an uptrend.
Market Leaders and Sentiment
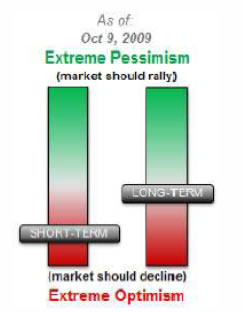
The sentiment indicator (courtesy of Sentimentrader) is almost neutral on a long-term basis, and it may be telling us that we are not at a major top. This is why we cannot jump to possibly false conclusions and we should just let the market pattern play itself out. On the other hand, the short-term indicator is bearish and fully supports the short-term indicators which are saying that we are ready to reverse.
From Mike Burke's Technical Market Report: "Last week, the new highs picked-up enough to assure us that the rally is likely to continue."
That statement about the new highs is not one that we should be getting at a major top, and it matches the picture shown by the long-term sentiment indicator above. There are plenty of signs to support a short-term reversal and the decline ahead may turn out to be just that. Unless they have suddenly become totally irrelevant, going against these two indicators would only be wishful thinking.
Historically, the NDX has tended to under-perform the SPX at an important market top. Currently, they appear to be performing alike. Another reason not to label this a major top just yet!
Summary
A short-term reversal is almost assured, but the sentiment indicators tell us that we should not expect a major decline at this time. Should we ignore them? Probably not a good idea! Why not let the market's future action decide?
The following are examples of unsolicited subscriber comments:
Awesome calls on the market lately. Thank you. D M
Your daily updates have taken my trading to the next level. D
… your service has been invaluable! It's like having a good technical analyst helping me in my trading. SH
I appreciate your spot on work more than you know! M
But don't take their word for it! Find out for yourself with a FREE 4-week trial. Send an email to ajg@cybertrails.com .
By Andre Gratian
MarketTurningPoints.com
A market advisory service should be evaluated on the basis of its forecasting accuracy and cost. At $25.00 per month, this service is probably the best all-around value. Two areas of analysis that are unmatched anywhere else -- cycles (from 2.5-wk to 18-years and longer) and accurate, coordinated Point & Figure and Fibonacci projections -- are combined with other methodologies to bring you weekly reports and frequent daily updates.
“By the Law of Periodical Repetition, everything which has happened once must happen again, and again, and again -- and not capriciously, but at regular periods, and each thing in its own period, not another’s, and each obeying its own law … The same Nature which delights in periodical repetition in the sky is the Nature which orders the affairs of the earth. Let us not underrate the value of that hint.” -- Mark Twain
You may also want to visit the Market Turning Points website to familiarize yourself with my philosophy and strategy.www.marketurningpoints.com
Disclaimer - The above comments about the financial markets are based purely on what I consider to be sound technical analysis principles uncompromised by fundamental considerations. They represent my own opinion and are not meant to be construed as trading or investment advice, but are offered as an analytical point of view which might be of interest to those who follow stock market cycles and technical analysis.
Andre Gratian Archive |
© 2005-2022 http://www.MarketOracle.co.uk - The Market Oracle is a FREE Daily Financial Markets Analysis & Forecasting online publication.