


The State of the American Economy in One Chart
Economics / US Debt Nov 12, 2009 - 01:31 PM GMTBy: Ceri_Shepherd

 They say a picture paints a thousand words. Well this picture paints very clearly the American Economy for the last 30 years.
Ever decreasing Bond Yields which = EVER EXPANDING DEBT.
The chart below shows that interest rates have been decreasing by approximately 0.5% every 2 years. Put simply, As the price of debt becomes cheaper more is created and then spent, and that effectively is the economy.
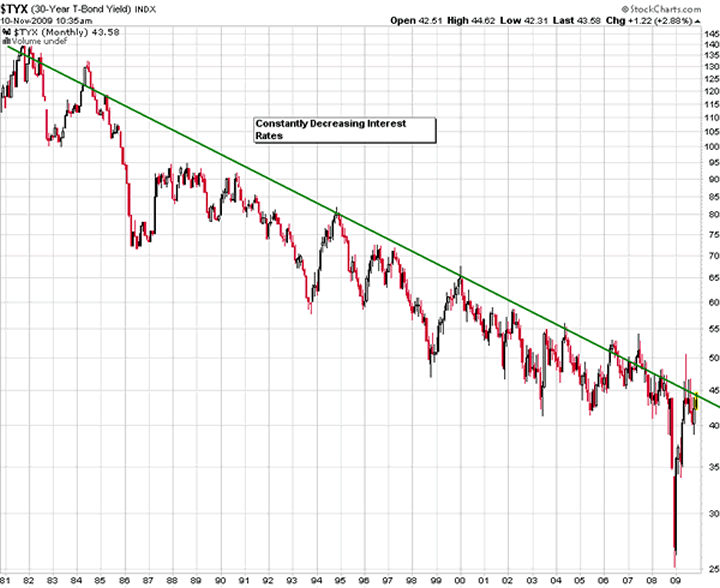
In 1981 the 30 year bond which is a good approximation for mortgage rates, was yielding 14% today it yields 4%. Mortgages will be slightly higher as it is perceived that it is safer to lend to a bankrupt Government than the public.
The interest rate has dropped over the last 30 years because the Fed has constantly dropped the short term Fed funds rate and we are now at 0%. The longer dated bonds will follow, as the 30 year Bond chart above very clearly shows,!! it is simply maintaining the yield curve.
Considering that virtually all lending by the banks is SECURED in some way on property. As secured lending accounts for well over 90% of all consumer lending. By constantly dropping interest rates, in line with the trendline above or 0.5% every 2 years, you will GUARANTEE A CONTINUOUS HOUSING BOOM.
Which is exactly what we have had for the last 30 years.
That is until the market runs ahead of itself and then crashes WHICH HAS NOW HAPPENED, or until you reach the ZERO BOUND position of 0% interest rates WHICH HAS NOW ALSO HAPPENED.
The economy is 70% based on the consumer, and the consumer has been trained over the last 30 years, just like Pavlov dogs to expect ever decreasing interest rates and attendant increasing property prices. However the Fed have a problem they have no more food for the dogs, as they are now at 0%.
When you look at the chart above, have the Fed actually been setting interest rates? Or have they simply been adjusting them, to maintain the downward sloping trend line of the 30 year bond?
In the good old days as soon as the consumer creaked the rallying call went out DROP INTEREST RATES. The theory being if he/she can afford 50,000 of debt at 10% then he/she can afford 100,000 of debt at 5% !!! the 50,000 of new debt money will be spent in the economy and can be booked as “Growth”.
The Consumer is tapped out, so now the Government has taken over the perpetual debt machine, as they are the only big debt spender left in town.
The so called economy is nothing more than a consumption Ponzi Scheme. That has needed continuous feeding with a diet of ever decreasing interest rates and ever increasing consumer debt to survive. When you take on a loan they only lend you the PRINICIPAL they do not loan you the INTEREST, so either more debt is created by continually dropping interest rates, to cover this interest. Or you make the population bigger, more people entering the perpetual debt machine and taking on debt, hence all the immigration over the last 10 years. Whatever happens the total debt outstanding made up of Government, Consumer and Corporate debt. Must I repeat MUST get bigger or the system implodes. PONZI SCHEME.
Now we are at the 0%, and this gigantic Ponzi scheme of an economy has been exposed for what it really is nothing more than an elaborate financial PONZI SCHEME, there is no plan B. Apart from the Government spending lots of freshly printed Dollars therefore devaluing the purchasing power of all existing Dollars, Ultimately, it will be death by inflation.
By Ceri Shepherd
www.trendinvestor.info
http://trendinvestor.blogspot.com/
© 2009 Copyright Ceri Shepherd - All Rights Reserved Disclaimer: The above is a matter of opinion provided for general information purposes only and is not intended as investment advice. Information and analysis above are derived from sources and utilising methods believed to be reliable, but we cannot accept responsibility for any losses you may incur as a result of this analysis. Individuals should consult with their personal financial advisors.
© 2005-2022 http://www.MarketOracle.co.uk - The Market Oracle is a FREE Daily Financial Markets Analysis & Forecasting online publication.