


Gold and the Last Real American Dollar
Commodities / Gold & Silver 2009 Dec 11, 2009 - 12:44 PM GMTBy: Bill_Downey

 Every now and then there are extraordinary events that occur that end up shaping the world for many years to come. The Lincoln and JFK assassinations come to mind. More recently, 39 years ago (Dec 8 1980), John Lennon was gunned down in front of his own house. In many ways, the generation that grew up with him, grew up that night. As he eloquently put in his post Beatles album, "The Dream is Over." For that generation it was.
And what of JFK?
That day in Dallas was in many ways where the changing of the guard that Kennedy inherited was circumvented. Indeed, one can only ponder had the "old guard" not regained control of the throne what the potential for this day and age might have been.
Now a lot has been written about JFK, good and bad, true and false, and the realm of conspiracy has been pondered by most that have done any study of the events. But that is not what this is about.
This is about the last REAL AMERICAN MONEY.
When one looks at real money, gold coins per se, it is hard not to notice the references to freedom and liberty. That is because "REAL MONEY" is freedom.............and liberty. It always has been, and it always will be. The truth be known, the modern route to slavery is through DEBT.
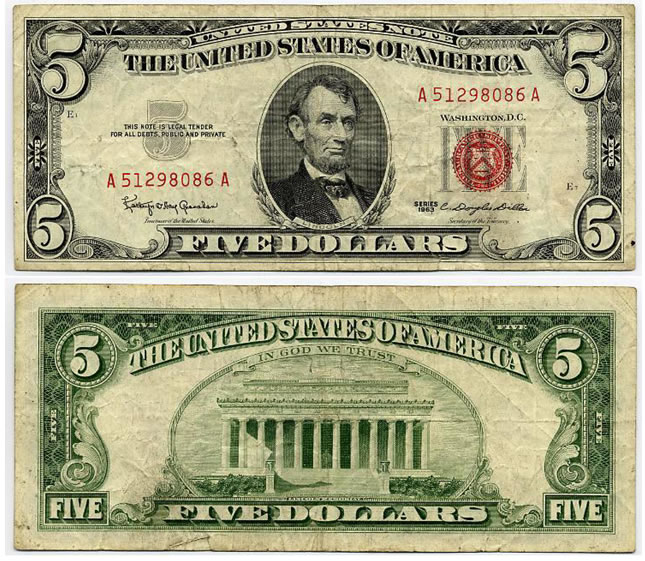
Take a good look at this five dollar bill above. There is one thing that is different than any other bill you have seen in circulation. That difference when viewed in the lens of today has profound implications. Can you spot what the difference is? (It is not the red seal) Take a few moments before your read the answer below. Take a good look. What is different and what is the implication?
What many people don't know about JFK is that he was the last American President to print money that was NOT backed by the Federal Reserve. Let me repeat the last portion of the sentence. ..........MONEY THAT WAS NOT BACKED OR PRINTED BY THE FEDERAL RESERVE!!!
What you are looking at is a "UNITED STATES NOTE" - So ordered by John F Kennedy, president of the United States. Look at the very top of the front of the bill, at the very top middle. See how it says "UNITED STATES NOTE" instead of "FEDERAL RESERVE NOTE"?
Constitutionally, JFK had this money printed. Only Government has the legal authority to coin legal tender money.
The ramifications are too much for me to contemplate, but the bottom line is that JFK was issuing money (REMEMBER THE 2 DOLLAR SILVER CERTIFICATE BILL) that was either backed up by silver or in this case above, was not "BORROWED" from the Federal Reserve. Now if the Feds had gold to back up all that they would print it would be a different story. But they do not.
It is often said that if you want to get on the trail of the truth in history, follow the money. While we will never know the entire details of the JFK assassination, I find it interesting that these bills were QUICKLY CANCELLED after his assassination and not issued? Why?
One way or another, the Federal Reserve, the ones who are up to their necks in sharing the responsibility for the current collapse of the USA, regained "control" of the money supply with the death of JFK. That is a very big historical convenience wouldn't you say?
When push came to shove in 1971, Richard Nixon closed the gold window forever. This became the point of LIFT OFF (INFLATION) FOR THE ENTIRE GLOBAL ECONOMY we know of today. In fact, the first place Nixon headed after the gold window closed was to CHINA................TO OPEN THE DOOR OF TRADE. It really was about minimizing inflation by transferring the manufacture of US goods at an extremely low labor cost point of manufacture. The rest is history. The USA's manufacturing base (the production of things) was basically transferred to China.
Let's look at the change since then and see how gold has reacted. From August 1971 to January 1980 Gold moved from $42.50 per ounce to $875 -- 102 months (EST) From April 2001 to January 2009 Gold moved from $255 per ounce to $1227 -- 104 months (EST) Does history repeat? Has it already repeated?
The gold chart above is suggestive that we have arrived at a very important point on the price chart. The convergence of these channel lines suggest that the 1200-1400 area is the point where we have either reached a major high in gold and a good pullback is about to occur, or it is the point where a total melt up could develop from a gold perfect storm environment of currency collapse, war, and an inflationary spiral due to mass currency printing that engulfs the entire world?
OR.................as the few (very few) lone voices tell us..............all this will not inflate things, it will deflate things. To which all of us laugh. (But a few of us ponder).
A long term perspective to ponder................
US Dollar index December 1979 = 85 US Dollar index December 2009 = 76
There are a couple of ways of looking at the dollar and what it might mean.
The dollar has only dropped 9 points since 1979 or about 10% (see red arrows on chart). In thirty years, the dollar is only marginally lower. That is an incredible statistic. And what about 1980, what happened there. Interest rates were raised to 21%. That was some dollar rally.
What else might we postulate?
That the real drop from all this printing has not even begun in the US Dollar?
The problem with looking at the dollar index is that it is measured against all other currencies. The dollar's 10% drop is because for the most part, the rest of the world is keeping up with USA's printing press. At least over the long run. But as we can see in 1980, who on this planet at the time that gold was 875 was forecasting that the US Dollar would climb from 85 to 165? Not many. A few? Sure.
This is where we see the difference in the long term as gold investors. How can we value gold?
"How much things cost on Aug 15th, 1971" to what they cost at $900 dollar gold"
Dow Jones Industrial Average 890 or 25 oz. gold in 1971, versus 10,000 or 11 oz. gold today. Average Cost of new house $25,250 or 721 oz. gold in 1971, versus 250,000 or 277 oz. gold today. Average Income per year $10,600 or 302 oz. gold in 1971, versus $70,000 or 77 oz. gold today. Average Monthly Rent $150 or 4.3 oz. of gold in 1971, versus $824 or .8 oz. of gold today. Datsun 1200 Sports Coupe $1,866 or 53 oz. gold in 1971, versus $28,400 or 31 oz. gold today.
As we can see the difference is in purchasing power. We can buy a lot more for our gold today. The above example shows for the most part, we can buy things at about 1/2 the price of 40 years ago. Some things on the list are 1/4 the cost.
Now the 64,000 dollar question. Based on purchasing power...............
Is gold overpriced, underpriced, or just right? Perspective is everything.
One of the things we can be certain of is gold is in some way a "panic" or loss of faith instrument. It is certainly an "emotional" investment. In this current case, a loss of faith in the system of fiat currency and the debt that has ensnarled the globe is the main driver for gold. The assumption is that all of the financial incidents that are transpiring are INFLATIONARY down the road. We must admit, it is a UNIVERSAL opinion and the history of the dollar debasement is a hard argument to debate. Still, I always get uneasy when I am in a situation in the investment world that is universal.........if you know what I mean?
The history of the USA and precious metals is a study in itself, and it's not the first time that the government has fiddled with the "golden violin." Ever since the abandon of gold and the US Dollar float, an incredible and highly leveraged and complex global world economy has developed. It is a development that has been building up over the past forty years and from a long term perspective has reached a point where the leverage itself has become the single biggest danger to the growth and sustainability of economic development. To fathom there's 600 trillion dollars worth of derivatives out there is a testament to the height of this leveraged insanity. And that in essence is the problem.............."Leveraged debt." New debt is backed by.............old debt. It must because debt is the only instrument we have for backing.
During the 2008 meltdown, the real estate default was a major contributing factor. Now we hear nothing about it in media, we just see the for sale signs as we drive our cars. The commercial real estate market is nearing the point of "RESET" -- commercial loans have a much shorter maturity, and the default rate of mortgages themselves continues to grow at a faster rate.
The next set of "MEDIA" event has been set off by the Dubai Default, and the news has quickly come to the forefront of the gold market. Six banks were quietly closed in the USA last week. The FDIC IS BROKE.
Just a few weeks ago, Japan printed some 10 trillion yen in order to provide another stimulus to an economy that is in the government's words..........still in deflation. This has been going on now for twenty years in this market. Greece and now Spain are being mentioned in the media as credit risks. We're going from consumer bust, to institutional bust, and now we are nearing NATIONAL BUST.
In an interesting twist, behind this cloud of toxic debt has been the accumulation of gold by China, India and a host of other nations. And the internet stories continue to grow. The mint is reporting a shortage of coins, and there have been stories about tungsten found in 400 ounce gold bars. The most interesting reports out there are stories in which the major shorts in the market are offering cash premiums to settle delivery contracts. Coupled with the price action of gold, it is difficult not to surmise a continued bull market in the metals. Don't all of these things indicate SUPPLY SHORTAGE DEAD AHEAD?
Throughout the year, I have postulated that as long as the debt melt down situation of 2008 does not return, that the metals should continue moving higher. This observation is based solely on what transpired in the markets of 2008 and there is always the potential that this time could be different.........but that is usually not the long term case in commodities. In 2008 the real selloff was not the FIRST default news, but the SECOND and THIRD. Is there a second story on the horizon?
I do not portend to consider that I fully comprehend the machinations and complexities of the fundamental aspects of what is transpiring around the globe. I use it as a backdrop in trying to understand the aspects of what it does to market prices.
During the last market melt-down the US Dollar was a benefactor. The chart clearly shows a rally of significance developed in July 2008 and the peak price in 2009 was right at the stock market bottom. Since that time, the US Dollar has been in a massive downtrend channel. Recently a very important point was touched on the US Dollar. A channel support line drawn off the last lows of 2008. This chart was included in our weekly update, and provided a break point of 74.00-74.25 for the US dollar. Since that low, we can see two things of importance. First that the area of support held, and since that time price has made its first attempt to break out of the downtrend channel. Price is now at a key MOVING AVERAGE on the chart for the first time in a year.
The 76.50-78.00 area is an important area for the US Dollar. If all they say about the carry trade is true, then the crowd that is in the US dollar is going to have to be very careful. If the players all start heading for the exit door at the same time, the dollar could become a local favorite for a short while here.
So far, it's only a lift and while the move is coming form a key area, it is only the first move that the dollar has been able to muster in a month.
Should additional "DEFAULT EVENTS" begin to surface however, the potential for the dollar to rally into mid January becomes very real? Even on momentum alone, a further rise could set off a wave of buy stops. Those short the dollar should remain very cautious.
Initial resistance would be the 78-80 area on a weekly basis. Even that type of rally would provide a window to see if all other markets will go in the other direction.....DOWN.
IF THEY DO --- THEN THE SYSTEM REMAINS BROKEN AND FURTHER TROUBLE LIES AHEAD.
In other words, if the financial world has come down the point that everything runs counter to the dollar -------------no matter what the instrument and fundamental is, then the investment world will remain a dangerous area prone to huge swings one way and then another without any fundamental consideration. It will all be dollar driven, and that is not a good thing.
Investors need to be thinking in three timeframes. Short, medium, and long term.
Over the short term, the potential for a dollar rally is one that we have been on the watch now for a few weeks, and we have either just witness our usual BLIP EVERY 2-3 weeks or so and price is about to turn right back down. However, should we move above the blue moving average on the chart, a potential rally to mid January could be in the cards?
Over the medium term, the potential for a dollar rally we feel lies with the current low we just saw at the 74 area. Should the US Dollar not rally from this point...................and turn back down from here and close below the 74 area............I would anticipate a rather large drop to below the 70 area. In that event, the odds that gold would exceed the 1300-1400 area would be great.
It will be important to watch the US dollar over the coming month. As long as it remains above the channel lines on the chart above, the potential for a rally will remain in play. The EURO also gave a confirming sell signal over the short and potentially the intermediate term.
We anticipate that the month of December will be a month of consolidation. Odds favor a pullback/consolidation to the potential area of 1070-1095 and/or the Monthly support of 980-1030 would be targets.
In sum, odds favor a range bound month in December.
For now, the medium and long term trends of gold remain intact. We have a suspicion that one way or another, the 1250-1300 area is going to be a major point on the chart. Should gold exceed that area, we would think a move higher would be in the cards. Until that time, we have to keep our mind open to change and to go with the price flows.
At www.Goldtrends.net , we follow all the timeframes of the gold market right down to the hourly trend. We are currently monitoring and watching the pullback in gold. If you'd like to follow along with us then drop by the website (where registration is not yet required) and check out ALL of the gold and silver analysis provided there for your review.
May you all prosper in the coming month,
Bill Downey
Bill Downey is an independent investor/ trader who has been involved with the study of the Gold and Silver markets since the mid 1980’s. He writes articles for public distribution for other newsletters and websites as well as his own free site at: http://www.goldtrends.net/
Email: Goldtrends@gmail.com
© Copyright Bill Downey 2009
Disclaimer - The opinion expressed in this report is the opinion of the author. The information provided was researched carefully, but we cannot guarantee its total accuracy. The report is published for general information and does not address or have purpose or regard to advise specific investments to anyone in the general public. It does not recommend any specific investment advice to anyone.
© 2005-2022 http://www.MarketOracle.co.uk - The Market Oracle is a FREE Daily Financial Markets Analysis & Forecasting online publication.