


Gold Is Heavy But Could Rebound Here
Commodities / Gold and Silver 2010 Jan 03, 2010 - 12:08 PM GMTBy: Mark_Brown

 Although December’s heavy sell off in the Gold (and Silver) market confirmed a significant set of monthly and weekly cycle highs, highs that may take this metal some time to meet/exceed, there now appears to be plenty of credible technical evidence to suggest that Gold may be ready to mount a minor rebound rally back up toward the $1,125 to $1,135 price zone. There are a couple of key market analysis tools that we can rely on to see if we can both confirm and then capitalize on a possible swing back up to a major Fibonacci resistance zone. Let’s take a closer look right now.
Gold Trend
Graphic credit: Ensign Windows
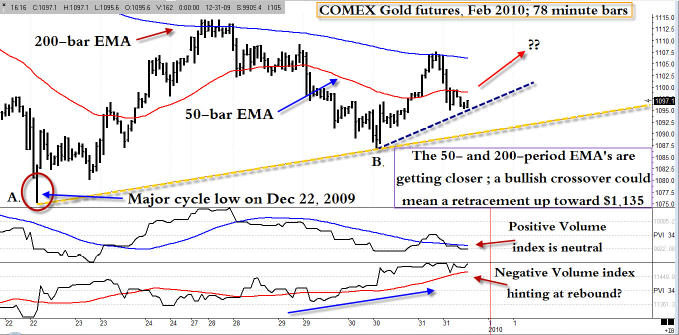
On December 22, March Gold made a major cycle low on its 78-minute chart at $1,075.20 (See point ‘A’ on the chart. Yes, ‘78’ is close to a significant Fibonacci ratio) and then began to slowly reverse higher. The spread between the 50- and 200-period exponential moving averages (EMA’s) was near an extreme at the time of the dead low but have begun to progressively narrow since then. Along with the narrowing spread (which typically indicates a period of price consolidation), March Gold also managed to make a higher swing low (point ‘B’ on the chart) on December 30, 2009. This higher swing low also permitted the plotting of a major uptrend line (gold dashed line), one that will be a wonderful trend-determining assist for both intraday and daily-based swing traders in the days and weeks to come.
Higher Lows
Once the first higher low was made (which was also a cycle low) at point ‘B,’ prices accelerated higher, bouncing back lower after colliding with the 200-period EMA (pink rectangle) before forming yet another higher swing low. Not surprisingly, this fresh 78-minute swing low has allowed us to plot a slightly more aggressive uptrend line (blue dashed line), which, if it should hold, is a prime clue that Gold intends to meet and then likely exceed the 200-day EMA (currently near $1,106) on a close. As most technicians know, a close above the 200-period EMA is a bullish development, and one that a zillion traders and money managers use to determine the long-term trend for a given time frame. Additionally, if the 50-period EMA (red line) crosses above the 200-period EMA (blue line) a second bullish confirmation occurs, one known as a ‘Golden Cross.’ Traders frequently wait for a pullback toward the 50-period EMA after such a crossover to initiate new long positions. Should we see this crossover occur, that might also be an excellent way to help time a series of daily or intraday (60 or 78 minute) swing trade(s), looking for Gold to move higher into significant Fibonacci resistance.
Are We Positive?
Volume analysis can be accomplished by using both the Positive Volume index (PVI) and the Negative Volume index ([NVI] they’re plotted in the lower panels of the chart). Using a 34-period EMA to track the trend of each index, we find that Gold has been rising steadily on negative (lower) volume even as it’s been move sideways to slightly higher on bars with positive (higher) volume. Typically, this is a pattern seen in the early stages of accumulation, and the real tip-off that Gold intends to bust above the 78-minute 200—period EMA will be when both the PVI and NVI are both moving higher, with each index above its respective 34-period EMA.
Resistance Levels
Based on the high at $1227.50 (December 2, 2009) and the major low of $1,075.20 (December 22,2009) and the intermediate swing highs made in between, major Fibonacci resistance appears at $1,134.40 and $1,134.90. This is a combined Fib 38.2% and 61.8% confluence area, one that will almost surely act as a powerful resistance and/or reversal area in this time frame. Bear in mind that $1,135.00 is likely a maximum retracement area, and price may stall well below that area, possibly around the $1,120-$1,125 area. OK, so how to play this anticipated swing move up in March Gold?
Golden Cross
One idea might be to wait for a Golden Cross to occur and try to enter long on a retracement back to the 78-minute 50-period EMA. Then, simply stay with the trade until you see a close below the 50-period EMA. More aggressive traders might try to jump in on a buy stop entry just above $1,097.10, using the fresh blue trend line as an initial stop (about $1,095.50) with a price target of $1,104.00 to $1,105.00, just shy of the 200-day EMA. Trailing a 3-bar stop of the 78-minute lows could also be a simple way to lock in any gains that may accrue; some traders might also want to take half profits near the 200-day EMA as a safety precaution, ‘just in case.’
Down Cycles in Force
What happens should Gold make it back up to $1,135.00, anyway? Well, who really knows? Our best guide is our arsenal of intraday, daily, weekly and monthly charts, learning to rely on the ample amounts of data that they continuously provide us with. However, from the standpoint of the higher time frame price cycles, Gold is still likely to move lower from such a run up to major Fib resistance, as both the weekly and monthly price cycles are still in heavy ‘down’ mode. Ultimately, if $1,050-$1,070 fails on a retest, expect a move back down toward the upper $970 to $990 area before major support kicks in and the major uptrend resumes. Keep watching your charts and make sure you’re trading in the direction of the trend, no matter what time frame you prefer to engage the Gold market in.
Until next time, good trading and a blessed New Year to you!
By Mark Brown
To receive more information on trading ETF funds visit my website: www.ETFTradingPartner.com
Mark Brown is an independent trader who focuses on trading ETF funds. He has been involved in markets and money management since 1998. His unique trading model which uses a combination of analysis like: economy, market cycles, chart patterns, volume, market internals, and money management. Visit his site: ETF Trading Partner www.ETFTradingPartner.com
© 2010 Copyright Mark Brown - All Rights Reserved Disclaimer: The above is a matter of opinion provided for general information purposes only and is not intended as investment advice. Information and analysis above are derived from sources and utilising methods believed to be reliable, but we cannot accept responsibility for any losses you may incur as a result of this analysis. Individuals should consult with their personal financial advisors.
© 2005-2022 http://www.MarketOracle.co.uk - The Market Oracle is a FREE Daily Financial Markets Analysis & Forecasting online publication.