


Stock Market Rally in its Final Stages, Elliott 5th Wave?
Stock-Markets / Stock Markets 2010 Jan 19, 2010 - 12:36 PM GMTBy: David_Banister

 It’s time for a review of the broader market indices and possible implications for traders and investors: This analysis may prove controversial, but I tend to make big picture calls at critical junctures. This analysis is getting more bearish I realize, as I’ve been bullish since Feb 25th on the markets. I simply look at all the evidence, and instead of burying my head in the sand, I take it all in and plan accordingly. Being a perma-bull or perma-bear is a quick way to under-perform the markets. I try to be nimble and trade/invest accordingly. The next few weeks are likely to be volatile, possibly to the downside a bit. The market may not have peaked quite yet, but it’s feeling like the 8th inning in the game. Below are my thoughts:
1. It appears we have the qualifications to have a potential top in since the March 2009 lows. This is due to the rebound of the Dow to above my 10400 targets I put out in late February of 2009. We have had a 61% Fibonacci retracement of the 2007 highs to the 2009 lows. In addition, we have had about a 61% time period duration with an 11 month rally which followed a 17 odd month decline. From the world in which I work, this means that the markets have fulfilled intermediate objectives for a top.
2. The caveat in this analysis, is that markets could still work their way higher. Just because we have met certain typical patterns in Time and Price movement, elliott wave patterns and the like, doesn’t mean we have peaked for sure. The markets could continue in a higher % retracement of the 17 month decline and the indices work their way higher. What I am pointing out today is that the requirements for a top have been met, and we need to be on guard. Also, we have other non elliott wave measures I use that are giving me some topping signals (Below).
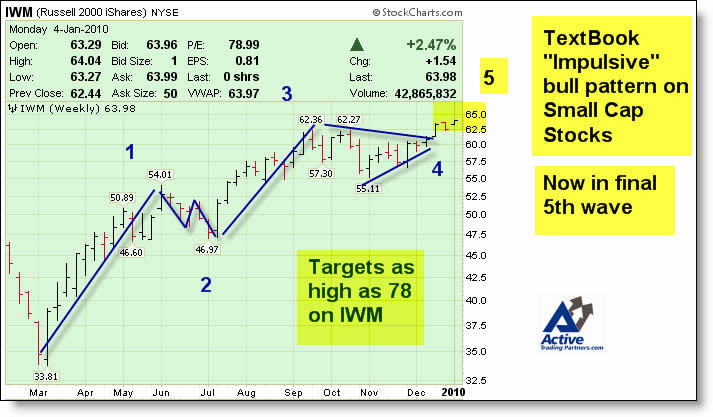
At the bottom of this post is my 5 wave Elliott pattern on the Russell 2000 index. I will again note that this pattern could be re-interpreted if I wanted into a 3 wave (A-B-C) corrective pattern. It is all in the eyes of the Elliott Wave beholder I guess. Sometimes you need to take a little poetic license in the analysis. Elliott wave theory is not foolproof by any means, so I try to overlay other factors. Read my Feb 25th 2009 article on 321Gold.com if you want to see my point there. We have bullish sentiment running at extreme highs. We have the VIX or “Volatility” index running at extreme lows. The last time we had this many bulls in surveys vs bears was July and October 2007. I think we all know what happened then.
Bull to Bear ratio is running at Extreme Highs
Therefore, whether this was an impulsive 5 wave pattern from March, or an A B C correction upwards… doesn’t matter much near term because in either event, the evidence is mounting for an interim top in the next 1-2 months or less. Tops don’t usually happen in one day or one week, they are a process… and we are mounting the top of this mountain I think. The bull to bear ratio is a warning flag.
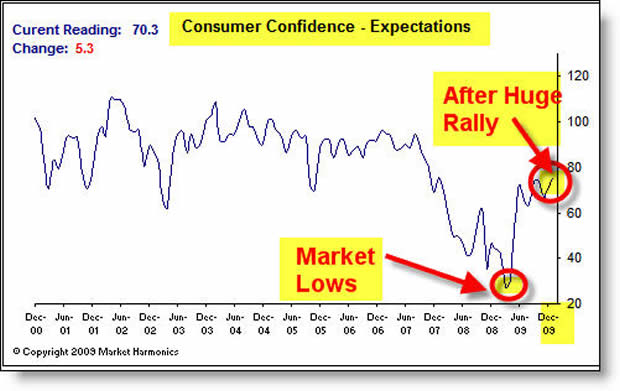
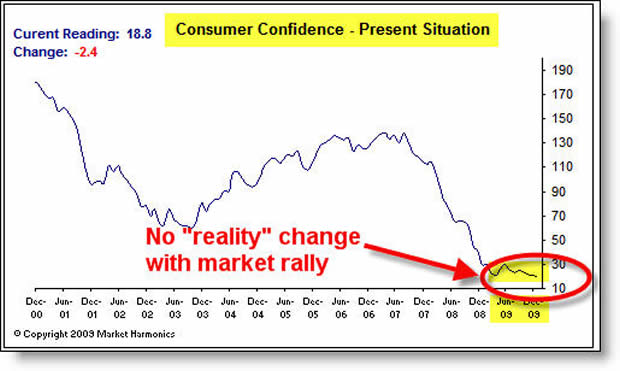
Other Factors: Consumer Expectations index has rallied from a low of 22 in February 2009 (My bullish article period) to a reading of 70 now. This would make sense as these bottomed with a low market, and rise with a rising market. This means expectations have soared off the lows, along with the markets. However, how people feel about their “present situation” is rather unnerving. It has hit all time lows even with the market rebounding. This is a potential problem for sure. This is also reflected somewhat in the % of bulls in the market vs the bears… again, a warning flag.
Bottom line: Markets are at a critical juncture of higher than normal risk levels here. This does not mean we can’t trade and make profits on the long side however. What it does mean is what I’ve been hinting at lately. We are in the 5th wave up in this structure since March lows. 5th waves can be very difficult to forecast as they can be extension waves or “truncate” and reverse sharply. Friday last week was ugly, but it was also options expiration week, making analysis more difficult. Partners in this service should note that we have been aggressively taking profits and removing positions off the table in the past two weeks, as well as general advice to raise cash levels a bit. Partners who are planning to stick around for the long haul should be aware that there are times in the market to be aggressive on the long side, and times to be high in cash and sit back for awhile. Right now, the evidence is to be more cautious and to have higher than normal cash balances while we wait for confirmation of market/wave patterns.
Other notes: Robert McHugh, is a very good Elliott wave forecaster and he is also beginning to make a convincing bearish cycle/wave case now. I often ignore his analysis as he has consistently been forecasting a top for 2-3 months now, and we have plowed ahead… but now I’m watching his work a bit closely to see if it mirrors my views. Eric Hadik is also a strong cycle and time forecaster, and again, not perfect. He is also looking for potential tops into latter February and early March. I also have not reviewed his work in 10 months or so, but am starting to review it again.
We need to be on our toes to be prepared to trim back positions if needed and to cut losses quickly if needed. This update is not to alarm anyone, as there is likely one more leg up in this up cycle to higher highs yet. However, let’s be on guard.
Here is the current IWM (Russell 2000 Small cap) index chart. It’s getting long in the tooth: Does this mean the market crashes from here? No, but again, it means we may need to be extra on the guard for an interim top and to again build higher than normal cash levels…and prepare to be defensive. Stay tuned.
Dave Banister
CIO-Founder
Active Trading Partners, LLC
www.ActiveTradingPartners.com
Dave Banister is the Chief Investment Strategist and commentator for ActiveTradingPartners.com. David has written numerous market forecast articles on various sites (SafeHaven.Com, 321Gold.com, Gold-Eagle.com, TheStreet.Com etc. ) that have proven to be extremely accurate at major junctures.
© 2010 Copyright Dave Banister- All Rights Reserved
Disclaimer: The above is a matter of opinion provided for general information purposes only and is not intended as investment advice. Information and analysis above are derived from sources and utilising methods believed to be reliable, but we cannot accept responsibility for any losses you may incur as a result of this analysis. Individuals should consult with their personal financial advisors.
© 2005-2022 http://www.MarketOracle.co.uk - The Market Oracle is a FREE Daily Financial Markets Analysis & Forecasting online publication.