


Stock Market Investing Game Plan
Stock-Markets / Stock Markets 2010 Mar 28, 2010 - 12:39 PM GMTBy: Toby_Connor

 Stocks:
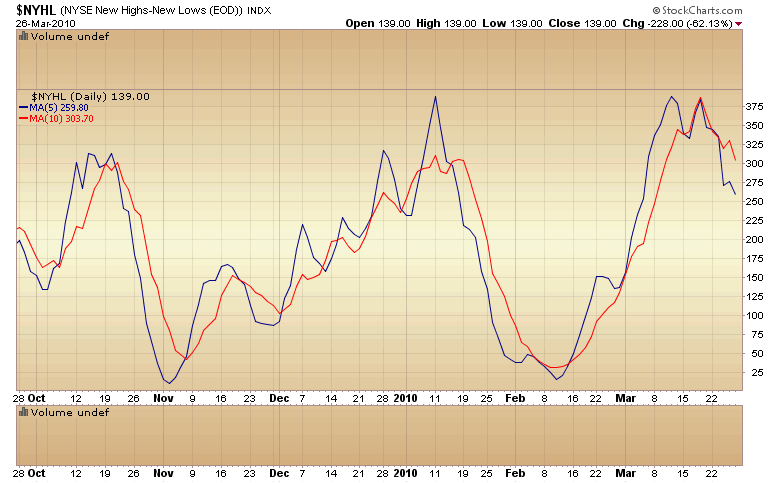
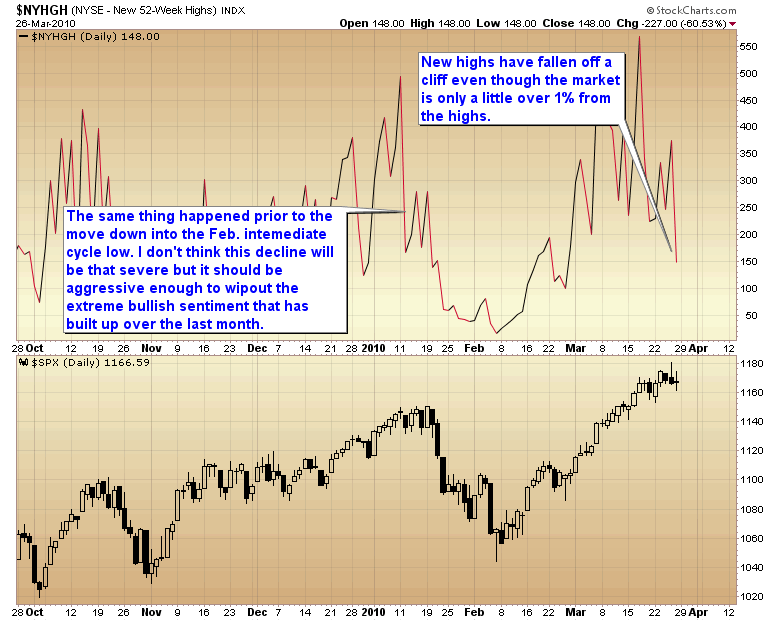
I’m going to start off with a few breadth charts.
The NYSE new highs – new lows chart is now on a sell signal as both the slow and fast average have rolled over and are accelerating downward.
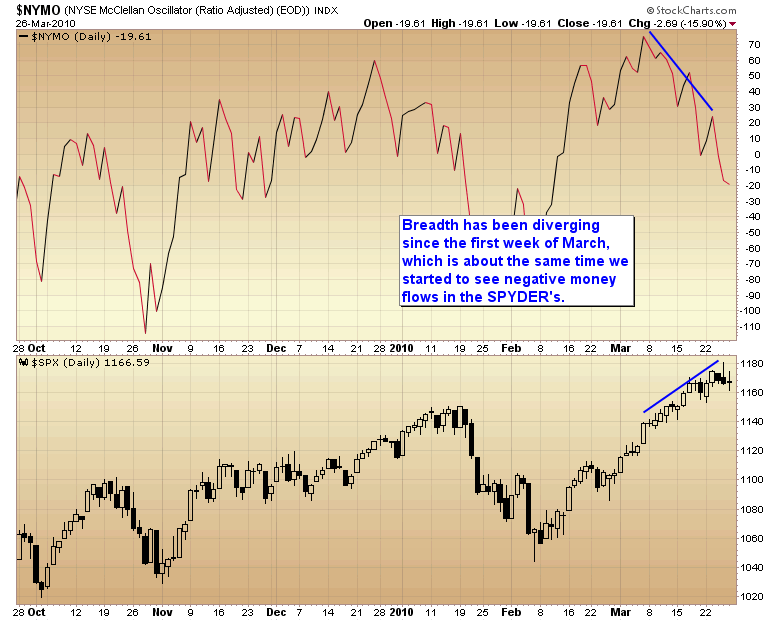
Everything continues to point to an impending correction. The change in character the last two days is also suggestive that something is different. Instead of opening lower and rising through the day, the market has been gapping up but closing lower. This is a complete about face from what has been happening over the last two months.
I will be monitoring sentiment as the market moves down into the correction. If investors get scared and panic quickly then this should be a short correction. If we were to get a sharp selloff this is what I would expect to happen. I’m talking 50+ S&P 500 points in 3 or 4 days.
If, however, investors have gotten locked into a buy the dip mentality it could slow the rate of decline and we might be looking at something lasting closer to 10 or more days.
I will say that what usually happens after one of these extreme momentum moves is that everyone heads for the door at the same time. The correction tends to be scary but over quickly as everyone panics all at once.
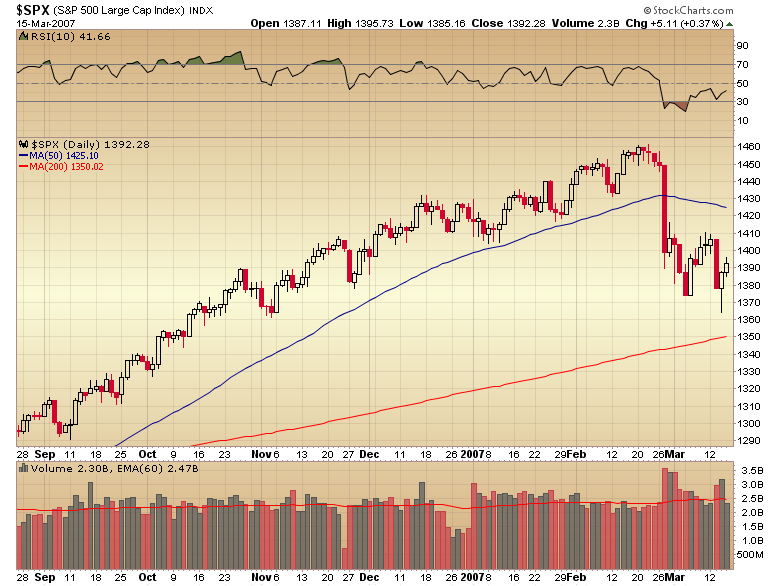
That’s what happened in February 2007 during the mini crash following the runaway move. The market gave back four months of gains in 8 days.
Now I don’t think we are going to give back 4 months of gains (this is only a daily cycle low not an intermediate cycle low), but I do think we could quickly fill the March 5th gap, which would be a 60 point loss. If that happened in 5 or 6 days it should be enough to swing the bullish sentiment all the way back to the extreme negative side of the boat. The market desperately needs to reset sentiment by going through another mini profit taking period and the sharper the correction, the better.
I’ve warned many times that the intermediate correction separating the second and third leg of the bull was only going to be a profit taking correction that would soon be recovered.
However, and as expected, while we were going through the last correction I had multiple traders inform me that this was the onset of another deflationary collapse.
Heck, I’m still seeing articles on the internet predicting another deflationary collapse any day now.
Often these predictions of disaster are associated with some imaginary trend line dating back to the 1970’s or 1980’s. I’ve even seen one site that based their predictions of an impending bear market on a trend line originating in the 30’s.
I have to ask, how many people from the 1930’s are still trading stocks and are there enough of them to really effect the markets? I have no earthly idea why a trend line starting back in the depression should have any significance at all to today’s market. Geez, some of the crazy stuff one sees in this business. It’s enough to make you wonder if common sense is dead.
I must say after watching both the tech and real estate bubbles expand and listening to the irrational reasons analysts gave at the time for why they weren’t bubbles, I have to think common sense is becoming a rare commodity in this day and age.
I’m going to let you in on a secret. Bull markets don’t end because of lines on a chart or Fibonacci retracements or anything technical related for that matter. Bull markets end when a fundamental shift occurs. They end when something breaks. In a secular bear market like we have been in since 2000 that fundamental shift almost invariably leads to a severe bear leg down in stocks and the onset of a recession…or worse.
We saw the first leg of the secular bear begin in 2000 as the world realized tech stocks were ridiculously overpriced, along with Greenspan’s monetary policies spiking the price of oil. The end result was a severe bear market and a recession.
We saw this again more recently as the credit and real estate bubbles burst. This was then exacerbated by Bernanke’s insane monetary response which, of course, did nothing to stop either one of those bubbles from bursting.
All Bernanke’s monetary response did was spike the price of oil to $150 and made sure we would have a very severe recession.
This is still a cyclical bull though and until we have a catalyst in place to kill it there is one game plan that should be followed. That game plan is one that everyone who has the slightest experience in the market should already know. In bull markets you BUY DIPs. And you continue buying dips until you see a fundamental change occur that is going to send us down into the next recession.
So once we enter the correction (it may have started with last Thursday’s key reversal) we want to be buyers of that dip. (I’m going to outline a game plan in a minute).
First off, let me state again that I seriously doubt the next leg down in the secular bear is going to come from a deflationary front.
We’ve already gone down that road. Bernanke proved he can defeat deflation with his printing press. Heck, he proved he could abort a left translated four year cycle with the power of the printing press.
I’m constantly getting into debates with traders pushing the deflation scenario. The fact remains that we had the worst deflationary period in 80 years and Bernanke halted it in 9 months.
Bernanke halted deflation the same way Roosevelt halted deflation in the 30’s by debasing the currency. I can assure you that if the slightest hint of deflation reappears, Ben will crank up the presses again. So I just don’t see deflation as the catalyst for the end of this cyclical bull.
The catalyst for the death of any bull market almost always comes from the area that is experiencing excesses.
In 2000 the catalyst emerged when the tech sector cracked. Everyone had become convinced these companies were eventually going to make unimaginable amounts of money, while amazingly enough overlooking the fact that most of them were making no money and never really had any reasonable shot at ever making any money. They were just burning through capital and at an incredible rate. Once the world woke up and realized the emperor had no clothes, down we went.
This collapse was exacerbated by Greenspan’s printing efforts to ward of the imagined 2000 contagion and had the unintended consequence of spiking the price of oil.
The latest catalyst as I mentioned above came when the overheated real estate and credit markets imploded.
So we have to ask ourselves, where is the excess this time? It certainly isn’t tech. The companies that are left are making money. It’s not the real estate markets. That bubble has already popped. And I don’t believe it is going to pop again. I doubt it’s going to come from the credit markets again, as people and banks are deleveraging now, and for years to come. Besides central banks have already figured out they can fix those problems by changing the accounting laws and by pumping liquidity.
So where is the dam going to spring a leak from this time? What is the area that is experiencing massive excesses that will eventually come back to haunt us?
I would say there are two. One of them is government debt. But I’m not sure that will cause problems though because governments control the printing presses. No matter how much debt they rack up they can always print enough additional money to pay it.
That leads us to the heart of where I think the next catalyst is going to emerge. The one area of incredible excess is the currency markets.
Let’s face it, every country in the world has been running the presses on overdrive since early 2008. This has created an ocean of liquidity covering the globe like no other time in history. It halted the deflationary spiral we were in last year. And it is certainly giving the illusion that good times are returning (heavy emphasis on illusion). But just like the credit bubble felt real nice while it was growing, there are going to be consequences for this excessive liquidity. The piper will eventually have to be paid.
I expect it will start when a small or maybe even a medium sized country's currency gets into trouble. Then, just as subprime infected the rest of the mortgage market, it will spread into other currencies. I strongly suspect the bull market will end when something breaks in the currency markets.
So until we see that happen investors should continue to buy dips and ignore all the Chicken Little’s predicting the sky is falling because we are approaching a trend line from 1932 or because this is the third of a third wave or whatever hokey nonsense they imagine will start the next bear phase.
As I have said, bear markets begin when the fundamentals break down, not when the technicals do.
The Game Plan:
Now with that in mind, and allowing that nothing in the currency markets has broken …yet, we need to plan for how we should proceed. At the moment traders should be mostly in cash as we await the correction into the daily cycle low. Once we get the inevitable correction we have a couple of options.
One, we can invest heavily back into the miners on the assumption that gold’s A-wave has started. That will certainly be an option, but one with a very big condition attached to it.
Gold must break below the February low. If gold doesn’t break below the February low of $1044 I think that option will come off the table.
The reason being that the intermediate gold cycle is going to be short as we go into this stock market correction. Usually this cycle will last about 20-25 weeks. If the cycle bottoms next week or the week after that it would put the intermediate cycle at 14/15 weeks.
Now it’s not unusual for gold to have a short cycle from time to time but if gold hasn’t made a lower low then we will be facing the distinct possibility that we are going to get another bounce that fails to make a higher high followed by a final move to lower lows that bottoms in the normal timing band.
The other possibility would be that February did mark the D-wave bottom and gold is now in a very tricky A-wave advance. This is a possibility but one that is going to be very difficult to game as we won’t really have confirmation unless gold breaks above $1161. And by that time the rally will probably be mostly over as A-waves rarely make new highs.
So while I know gold bugs will jump on a higher low as proof gold has bottomed, cyclically it would be much better if gold makes a lower low as that would have much higher odds of marking a true intermediate cycle low and probably the end of the D-wave.
It would also be a huge plus if the COT report shows a 90+ Blees rating. (The Blees rating is simply a measure of how bullish or bearish commercial traders are compared to the last 18 months and available to subscribers in the weekend reports). That’s not going to happen with gold above $1050.
The next thing I want to call attention to is Bernanke’s goal. It has always been his intent to inflate asset prices. And he’s certainly succeeded so far.
Now let me state clearly that I’m not a believer in the whole gold manipulation conspiracy theory nonsense. If gold were really being manipulated successfully then explain to me how in the world it’s managed to rise from $250 to over $1200 an ounce.
What I will concede is that the powers that be would probably prefer that gold didn’t rise. $1200 gold kind of makes a mockery of their phony CPI and PPI numbers. Now that doesn’t mean they can do anything about rising gold. A secular bull market is a secular bull market and nothing anyone does is going to stop that from running its course. What it does mean is that they are certainly not going to do anything to expedite the process.
What the powers that be do want is for the stock market to rise.
So I think we have to admit that if there is anything the government can do to help that process along they will, or at the very minimum they will certainly not do anything to hinder that from occurring.
So the second investment option when we get close to the bottom of the impending daily cycle would be to just buy the market (probably tech as it’s been outperforming and will likely continue to do so).
If the government wants the market going up then the lowest risk play would be to just take them at their word and go along for the ride.
Buying the QQQQ’s or the SPYDER’s would be, by far, the safest play if gold has not made a lower low and even if gold has made a new low it would still be the safest bet, although probably not the most profitable as an A-wave advance in gold should send mining stocks rocketing higher and would likely double the percentage gains possible in the CUBE’s or SPYDER’s.
So I will be watching gold as we move down into the stock market cycle low. If gold does not make a lower low like we want, then I think we are going to have to assume that we are going to see another failed rally that is unable to break the pattern of lower highs and that will roll over again.
Any positions taken in miners or metals at that point will have to be short term positions. That doesn’t mean those positions won’t rally. Many could rally 15 -20% which would probably be bigger than the stock market but we would have to go into those positions knowing we will be exiting again soon and that the odds are that this is just another deceptive bounce in an ongoing D-wave and not the explosive move of an A-wave rally.
If gold does fail to make a lower low I think the safer bet would be just to buy the market.
More in the weekend report for subscribers.
Toby Connor
Gold Scents
A financial blog with emphasis on the gold bull market.
© 2010 Copyright Toby Connor - All Rights Reserved
Disclaimer: The above is a matter of opinion provided for general information purposes only and is not intended as investment advice. Information and analysis above are derived from sources and utilising methods believed to be reliable, but we cannot accept responsibility for any losses you may incur as a result of this analysis. Individuals should consult with their personal financial advisors.
© 2005-2022 http://www.MarketOracle.co.uk - The Market Oracle is a FREE Daily Financial Markets Analysis & Forecasting online publication.