


Stock Market Crash of 2014
Stock-Markets / Financial Crash Apr 04, 2010 - 11:01 AM GMTBy: Daniel_Bruno

 At market turning points, mood is often extreme. Take the pessimism at the start of Obama’s term in January, 2009. Who would have guessed that Barack Obama’s first year in office would be the best for stock market shareholders in 76 years.? What’s more, the Standard & Poor’s 500 Index, which gained 70% in the past 12 months, has a lot of room to run if history is a guide. Since the 1960’s, the average bull market has lasted about 1000 trading days and the current run up has exhausted less than 27% of that time. It will still be running up during the 2012 presidential election, reversing the appalling loss of 3.3 million jobs in 2009 and boosting the already strong odds that Obama will win a second term. ( See www.scribd.com/dbsanz for more on this.)
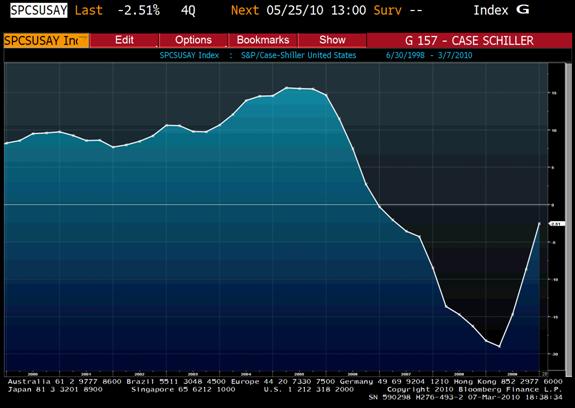
More than $8 trillion in U.S. government stimulus stabilized the financial system and has restored $6 trillion to stock market valuations since March 9, 2009. Shares prices continue to be buoyed by cheap money as the Federal Reserve keeps its target rate for overnight loans between banks near zero and worker productivity climbed at the fastest rate in seven years. Inflation remains contained, with consumer prices
excluding food and energy below 2 % . Home prices increased seven straight months through December, 2009 according to the Case-Shiller Index.
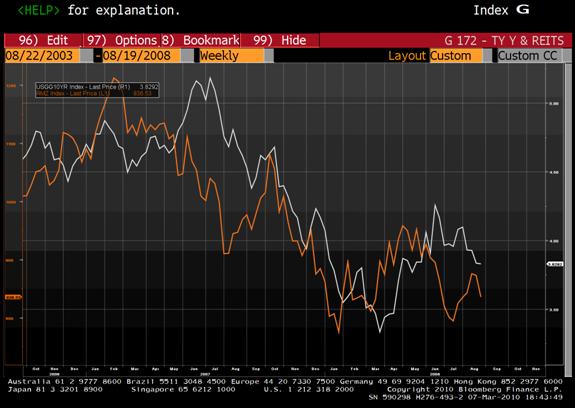
Bonds
U.S. investment-grade corporate bonds measured by Bank of America Merrill Lynch indexes have gained 34% since bottoming in October 2008, while
In 2010 the U.S. has sold $2.92 trillion in debt, most of it to China and Japan,
to help finance a budget deficit estimated at a record $1.6 trillion. Yields on 10-
year Treasury notes remain below 4 %, compared with an average of 5% since 1995, theoretically indicating rising confidence in the ability of the U.S. to pay back the money it owes. In 1982 during the last recession, 30-year yields were 14% and Paul Volcker, now 82 and whispering in Obama’s ear, was chairman of the FED.
Price to Earnings Ratio is Low
The S&P 500 is valued at 14.7
times 2010 profit should earnings for companies in the index
rise 27 percent in 2010. Wall Street firms predict total operating
income at S&P 500 companies will rise 50 percent in the next two
years, the biggest increase since the stealth bear market of 1994.
…But Caution is in Order and Lookout for 2014
Stock increases may slow as equity managers run out of
money to spend, history shows. Cash has dropped to 3.6 %
of U.S. mutual fund assets from 5.7 % in January, 2009,
leaving them with $172 billion in the quickest decline since
1991, Investment Company Institute data show. The last time
stock managers held such a small proportion was September 2007,
a month before the S&P 500 began a nearly 61.8% freefall. He fact that stocks fell 57%, but did not reach 61.8%, is a hint that the bias remains upward. 61.8 is no accident. It’s a very important number for predicting where stock prices will go and when.
If the current bull run lasts 1000 days it will reach exhaustion after
April, 2013. My research of market patterns and Fibonacci relationships paints a grim picture after that time. The odds of a Great Crash between May, 2013 and October, 2014 are high.
1994 BOND CRASH+21 = 2015
2000 CRASH +13 = 2013
1873 CRASH –1819 CRASH = 54 * 3.618 = 195.37 1819+195.37 = 2014
2002 LOW - 1982 LOW = 20 * 1.618 = 32.36 1982+32.36 = 2014.36
By Daniel Bruno
Chartered Market Technician
FXBOSS receives 24-hour streaming news and expert commentary. Over 70 FXBOSS forex specialists talk to trading rooms in the world’s currency capitals and track major political, economic and market events globally. They give you the instant, live, tradable information you need to judge the direction of the market, and make informed decisions about your trades.
© 2010 Copyright Daniel Bruno - All Rights Reserved Disclaimer: The above is a matter of opinion provided for general information purposes only and is not intended as investment advice. Information and analysis above are derived from sources and utilising methods believed to be reliable, but we cannot accept responsibility for any losses you may incur as a result of this analysis. Individuals should consult with their personal financial advisors.
© 2005-2022 http://www.MarketOracle.co.uk - The Market Oracle is a FREE Daily Financial Markets Analysis & Forecasting online publication.