


Fibonacci Trading Grids and the Fading Stock Market 1228 S&P 500 Target
Stock-Markets / Stock Markets 2010 Apr 28, 2010 - 03:28 AM GMT

 Investors and traders are increasingly recognizing the value of using Fibonacci ratios to anticipate support and resistance prices in major equity indexes. Fibonacci ratios are natural phenomena found in seashells, tree rings, music masterpieces like Beethoven’s ninth symphony, and even in the order found in the structure of galaxies.
A major equity index like the S&P 500 is particularly interesting for Fibonacci study, because it is effectively a proxy for discovering the Fibonacci ratios in the forces of global human action. Pat Dorsey at Morningstar recently reported that 40% of net income in the S&P 500 comes from outside the U.S., so the S&P 500, although not perfect, is a proxy for tracking activity in the global economy. A chart of the S&P 500 index is effectively a slice from the tree of global human action, and the Fibonacci ratios are the rings that reflect the stages of its growth.
Price turns created by key Fibonacci ratios in long-term S&P 500 price grids are often stunning and are a timely subject. In recent trade, the S&P has been closing in on an S&P target that offers a rare occurrence. It matches not one but two important long-term Fibonacci grid ratio levels. One of those levels is a golden ratio of 61.8% in a major S&P 500 move. The market is desperately trying to get beyond the level of 1228 in the S&P to keep the deflationary global financial crisis at bay. However, only a global sovereign debt binge has allowed the market to approach this important juncture.
In stock market cycle research at LongWaveDynamics.com (LWD), Fibonacci grids are utilized that include inverse Fibonacci ratios of 76.4% up to 100%. These are not actually Fibonacci ratios; they are 100% minus the actual Fibonacci ratios of 23.6% and lower, therefore representing the Fibonacci ratios approaching the 100% target of a price move. This allows the Fibonacci support and resistance price grid to be more clearly presented between 0% and 100% of a given price move. For the top and bottom prices, intraday highs and lows are used.
An example of such a Fibonacci grid is the entire move of the S&P 500 from the 1982 low to the 2007 high. Note that the S&P has been closing in on the 76.4% target, or 23.6% from the 100% target October 2007 high of 1576.09. If you follow LWD research, you know that every one hundredth of point is relevant, thus the two digits to the right of the decimal in these price targets.
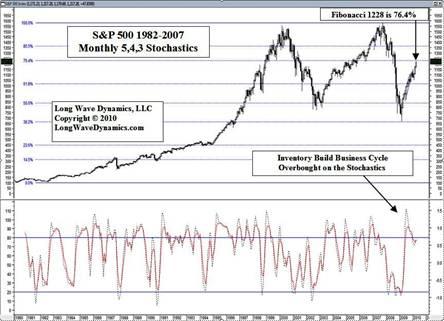
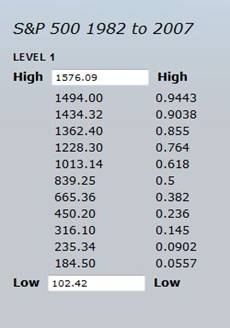 Investors and traders that have been following the numbers on the 1982-2007 Fibonacci grids over the past few years cannot help but be impressed by the force they can exert on the market at critical junctures. Note the 38.2% ratio, which temporarily halted the collapse of financial civilization, as we know it in March 2009, within a point of the 665.36 target on the grid above. The chart below presents the entire run in the S&P 500 from 1982 to 2007, and contains most of the Fibonacci price lines in the grid above.
The reason investors and traders should pay attention to these targets is that not only are they relevant numbers in the Fibonacci grid, but large traders and hedge funds use them in program trading, therefore the targets produce forces of support and resistance beyond their natural influence. Use of these Fibonacci numbers with program trading is for the sole purpose of outperforming Mr. Market. Recently the market has taken to flat lining, or gaping over or under important Fibonacci price support and resistance prices.
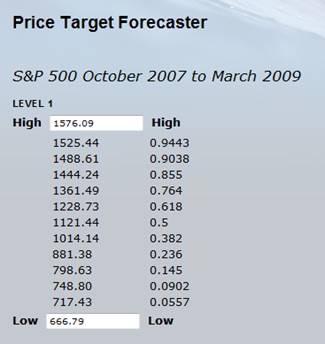 The Fibonacci ratio grid below is the grid between the October 2007 top and the March 2009 low. This is where it starts getting interesting. Notice that 1228 is also a price target on this grid, and it is the golden ratio 61.8% target. This is the Fibonacci price backbone of the 2007-2009 crash. The real question now is what sort of backbone is there in this debt driven rally. It has been an impressive rally, but has it only been a natural retracement, that has now played itself out? This is where we find out.
The chart below presents the Fibonacci grid from the 2007 high to 2009 low. The 1228 price level, being the golden ratio of the entire move, is the most important price resistance since the rally began from the lows in March 2009. The S&P was briefly able to break into the final 1982-2007 Level 3 Fibonacci range before the 1228 target on Friday, April 23, 2010. On Monday, April 26, 2010, the S&P hit 1219.80 intraday.
The Level 4 price grid is the grid between any two adjacent numbers in a Level 3 grid. The Level 4 ranges are too small to be of real use for investing and trading. The 1219.80 price was the exact 38.2% Fibonacci price target between the adjacent Level 3 targets of 1219.13 and 1220.89. Mr. Market is trading with these Fibonacci targets all day long, drilling all the way down to small Level 4 moves. What such pinpoint accuracy suggests is that Mr. Market is respecting the 1982-2007 Fibonacci price grids a great deal, so he may have plans to retest and take out the 2009 lows.
The 1219.80 S&P price high is less than 1% from the 1228 target. The S&P appears to be backing off from its assault on 1228. If the market cannot penetrate and stay above 1228 on a daily, weekly, then monthly close, then consider Shakespeare’s admonition on such matters, “On such a full sea are we now afloat, and we must take the current when it serves, or lose our ventures.”
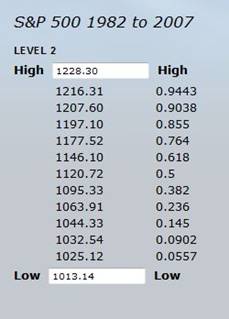 Investors and active traders should track the Level 1 Fibonacci price targets for key support and resistance. However, what is more interesting for traders is the market intelligence generated by drilling down to the Level 2 Fibonacci grid between any two adjacent numbers on the 1982-2007 grid, and then down to the Level 3 between any two adjacent numbers on that grid, and as demonstrated above, now we should even consider Level 4. Below is the final Level 2 grid on the way to the 1228 target. The S&P is currently trading in this grid. Watch these Fibonacci targets for intraday turns.
If March 2009 was the beginning of a new global bull market then the golden ratio and 1228 price target will provide only temporary resistance. It could also give way on the upside temporarily to the trillions in taxpayer-backstopped liquidity driving the global economic and equity market recoveries, even if we are not in a new bull market.
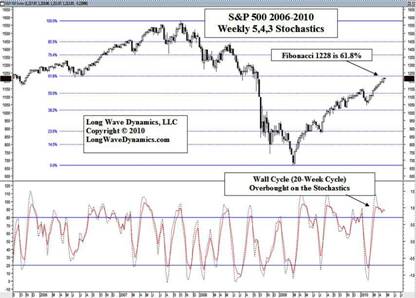
When analyzing such targets, it is helpful to bring other technical and cycle tools to the job. The global market rally that has accompanied the regular business cycle recovery shows signs of growing weary. Volume is weak. Various stochastic studies suggest the market is overbought in this business cycle, Wall cycle (20-week cycle) and the Quarter Wall (trader’s cycle). The next phase of the global crisis into 2012 is expected to be more severe than the 2007-2009 leg. If you want to learn more about our Fibonacci methods in price and time, check out our book, Jubilee on Wall Street; An Optimistic Look at the Global Financial Crash (2009), you can get a copy at Amazon.com.
The liquidity driven market action that has continued to take this market higher has chased out most of the short sellers, professional and otherwise. Shorts in the market create support in down markets. With mutual funds fully invested, who else is going to step in and buy on the way down. In short, pun intended, this market may have some air pockets in it when it finally turns south.
These grids represent Fibonacci in price. However, just as powerful as Fibonacci ratios in price, are Fibonacci ratios in time. Stock market cycles fluctuate in Fibonacci ratios in time around ideal cycle lengths. Coming up in late June, we have one of the Fibonacci extensions of the entire long wave. It will not end the current long wave winter and thus the long wave, but such Fibonacci target dates, like target dates in price, often exert a pull that can produce important cycle tops and bottoms of the smaller cycles. We are anticipating the cycles to run long, but if the Wall cycle (20-week cycle) that bottomed on February 5 is an ideal cycle length, it will end in June.
Golden ratios often produce opportunities for investors and traders. The 1228 target may now be fading. The Level 2 and Level 3 Fibonacci prices advancing to and retreating from this target will be active. For traders this could be a shorting opportunity better than October 2007, with a stop loss in place if the big banks trade this market higher and through the S&P 1228 target.
Investors should consider the forces that allowed the market to approach this golden ratio juncture. It could represent a final call to take profits. Traders and investors, and the politicians, should consider the odds of trillions more in global sovereign debt piled on over the past two years solving what at its core is a long wave debt problem. It will not end well, but no one rings a bell at the top.
David Knox Barker is a long wave analyst, technical market analyst, world-systems analyst and author of Jubilee on Wall Street; An Optimistic Look at the Global Financial Crash, Updated and Expanded Edition (2009). He is the founder of LongWaveDynamics.com, and the publisher and editor of The Long Wave Dynamics Letter and the LWD Weekly Update Blog. Barker has studied and researched the Kondratieff long wave “Jubilee” cycle for over 25 years. He is one of the world’s foremost experts on the economic long wave. Barker was also founder and CEO for ten years from 1997 to 2007 of a successful life sciences research and marketing services company, serving a majority of the top 20 global life science companies. Barker holds a bachelor’s degree in finance and a master’s degree in political science. He enjoys reading, running and discussing big ideas with family and friends.
© 2010 Copyright David Knox Barker - All Rights Reserved Disclaimer: The above is a matter of opinion provided for general information purposes only and is not intended as investment advice. Information and analysis above are derived from sources and utilising methods believed to be reliable, but we cannot accept responsibility for any losses you may incur as a result of this analysis. Individuals should consult with their personal financial advisors.
© 2005-2022 http://www.MarketOracle.co.uk - The Market Oracle is a FREE Daily Financial Markets Analysis & Forecasting online publication.