


Bears Seize Control of Schizophrenic Stock Market
Stock-Markets / Stock Markets 2010 Jun 07, 2010 - 03:44 AM GMTBy: Andre_Gratian

 Current Position of the Market
Very Long-term trend - Down! The very-long-term cycles are down and if they make their lows when expected, the bear market which started in October 2007 should continue until 2014.
SPX: Long-term trend - Up! We are in a medium-term bull market, which is a corrective move within a long term bear market. This bull market should last until 2011
SPX: Intermediate trend - It is likely that the index has made a top of intermediate nature. Unless it can hold above the 1044 level, the downtrend should continue until early July, and perhaps all the way into the Fall.
Analysis of the short-term trend is done on a daily basis with the help of hourly charts. It is an important adjunct to the analysis of daily and weekly charts which determines the course of longer market trends.
Daily market analysis of the short term trend is reserved for subscribers. If you would like to sign up for a FREE 4-week trial period of daily comments, please let me know at ajg@cybertrails.com .
Overview:
The stock market continues its schizophrenic behavior pattern. Since the 1040 low 7 days ago, the SPX has rallied 63 points, declined 33, rallied 28, and this past Friday declined 40. Where is the trend?
If we want to find one, we have to go back to the 1222 top of 4/26. In spite of the huge swings, the sum of it all has been pretty much downhill. By breaking below 1044.50, the decline almost changed its name to "intermediate", but since the index closed at a much higher level, it still remains in a short-term down-trend.
Perhaps not for long! On Friday, assisted by a disappointing jobs report, the bears were in full control and the SPX ended down 38 points. Technically, closing below 1044.50 should do the trick. With two dominant cycles which should continue to pressure the market and whose lows are still several weeks away, it looks like a slam-dunk.
The index is in a well-defined down channel, and its failure to make it to the top line before reversing on Friday could suggest that the downtrend is accelerating. And yet, the very bullish sentiment indicators may make this more difficult than it seems. Perhaps the contradiction can be reconciled with a brief dip below 1040 over the next 2 to 4 weeks before a strong reversal takes place after the cycles have bottomed. The distribution pattern at the 1220 level does have a potential count to the vicinity of 990, and further weakness could satisfy a Fibonacci projection to 975-950. If we can do 40 points in one day, there should be no problem doubling that in two weeks' to a month's time, especially if there is a background of more bad economic news.
The market's near-term path will be revealed over the next week or two. If the 1040 level has not been broken by the time the cycles bottom, the bears will have to wait until the Fall for their next opportunity.
Let's look at some charts.
Analysis
Chart Pattern and Momentum
The Weekly Chart is not very encouraging for the bulls. Positive divergence made a brief appearance in the lower (breadth) indicator, but has now disappeared and the indicator has made a new low. Last week, it came to rest at the bottom of the red channel and is in a pronounced downtrend. This indicator has a strong tendency to develop positive divergence before a market low can be expected. None of that now! So we can objectively assume that the price index has not yet made a low.
Same story with the upper indicator (MACD). It is in a downtrend and shows no sign of deceleration. The middle oscillator has become oversold, but the lines will have to cross before it can give a buy signal.
The price pattern remains above the 1040 level but, if we can trust the indicators, probably not for long. The SPX, which had found temporary support on the (green) mid-channel line now looks ready to move down into the lower half.
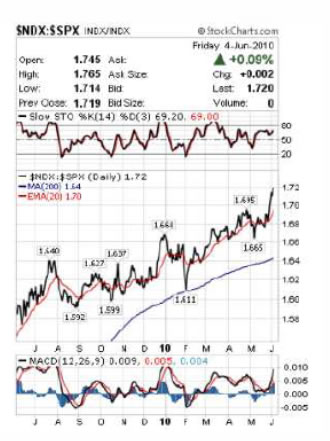
Let's turn to the Daily Chart. It looks only slightly more promising than the weekly. At the last low, some positive divergence developed in the lower two indicators, forecasting either a rally or a holding pattern. With Friday's action, the holding pattern is in serious jeopardy, unless the index can demonstrate that is has enough support to see it through the cycle lows that lie ahead.
After breaking below the 200-DEMA, the index has been stopped twice in its attempt at getting back above it -- the second time rather decisively. This also caused the rally to stop short of its downtrend line, which may hint at some acceleration of the downtrend.
The indicators made attempts at reversing but are in danger of turning back down if there is further price deterioration. The price index, which had broken out of the steepest channel, stopped on the mid-channel trend line of the larger channel. There, it has a reasonable amount of support which is provided by some trend lines that can be best observed on the hourly chart. With that existing support, the deeply oversold condition of the A/D, as well as the highly positive reading in the sentiment indicators, there is at least a chance that the index will hold the current level. This will be resolved in the near-term.
The Hourly Chart showed that, at the end of the day on Thursday, the near-term fate of the SPX -- which had some potential projections 10 to 20 points higher -- would be decided by the next day's jobs report. Now that this is behind us, where to? The close of Friday left the index just shy of a 1052 initial projection (pink line) and on good temporary support. As pointed out by several analysts over the week-end, the ratio of down volume to down issues was not quite as bad as one might have thought, and since a potential target for this phase of the move is a few point below (1052) and there is plenty of short-term support, it is possible that there will be an attempt to hold this level. But if the bounce turns out to be of the dead-cat variety, a move lower into the cycle lows would be probable (not necessarily all the way down to the 950 level, but to about 1000-1005 -- at least initially). A conservative P&F count taken across the top of the recent re-distribution phase also points to about 1000, where the bulls may make a stand if the 1040 level is broken.
This could be the low for the 17-wk cycle. And then, if the 2-yr cycle makes its low in early July, the next down move would take us to a final target in the 975-950 region. But this is too much conjecture. Let's see if the market can clarify its intentions over the next week or so.
Cycles
The more dominant cycles have been discussed profusely and do not need any elaboration. The projected cycle lows are marked on the charts above.
Projections:
To recap, there is an immediate projection to about 1052, a near-term target to about 1000, and a possible extreme drop to 950 when the 2-yr cycle makes its low.
We will wait until we have a firm indication of a reversal before discussing upward targets.
Breadth
The NYSE Summation index (courtesy of StockCharts.com) has now gone negative, and that is normally a confirmation that the equity indices are in an intermediate downtrend. But the RSI is telling us that we should start looking for a market bottom. It is as oversold as anything else which appears on the chart below, and the odds are slim that the index is going much lower.
Market Leaders and Sentiment
I have left in place The SentimenTrader (courtesy of same) of two weeks ago, so that it could be compared to the latest reading. As you can see, both give very similar readings which are predominantly bullish.
Two weeks ago Friday, the SPX had closed at 1070 -- 6 points above where we closed this past Friday. What ensued was a day's worth of holding, and then a decline to1040 with an immediate rally. Considering Friday's market position, something similar could take place over the next couple of days.
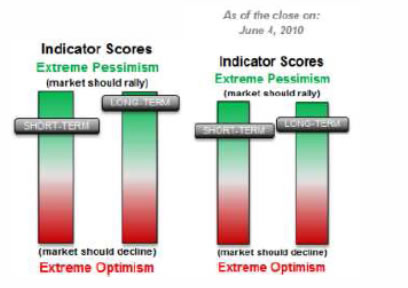
The next indicator (also courtesy of StockCharts.com) is very interesting and reinforces the bullish picture depicted by the one above. It appears to be telling the bears: "Enjoy your moment in the sun, because it will be short-lived."
Gold
GLD is doing precisely what it should be doing. It reached its 122 projection and is correcting. It may be making a final intermediate top in the form of an ending diagonal. One more pull-back would complete wave "d" and prepare the index for a move to its final destination of 128 or 131. After that, there should be an extensive correction process to between 100 and 105.
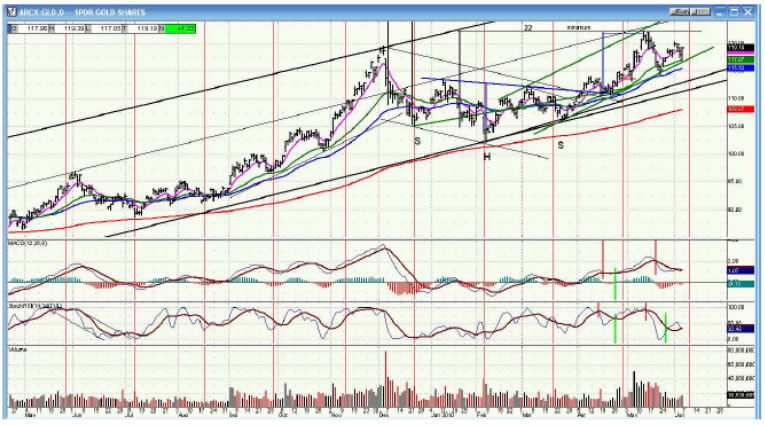
The correction target will be discussed more specifically after the final intermediate high has been reached.
Summary
Although the market indicators appear to be contradicting one another, it looks as if the correction is intent on changing its labeling to "intermediate" before there is a rally to test the highs. The ambiguity should be resolved by early July, at the latest.
Accordingly, the SPX could still drop to about 1000, and perhaps to as low as 950 before starting a new short-term uptrend.
If precision in market timing is something which is important to you, you should consider a trial subscription to my service. It is free, and you will have four weeks to evaluate the claims made by the following subscribers:
Awesome calls on the market lately. Thank you. D M
Your daily updates have taken my trading to the next level. D
… your service has been invaluable! It's like having a good technical analyst helping me in my trading. SH
I appreciate your spot on work more than you know! M
But don't take their word for it! Find out for yourself with a FREE 4-week trial. Send an email to ajg@cybertrails.com .
By Andre Gratian MarketTurningPoints.com
A market advisory service should be evaluated on the basis of its forecasting accuracy and cost. At $25.00 per month, this service is probably the best all-around value. Two areas of analysis that are unmatched anywhere else -- cycles (from 2.5-wk to 18-years and longer) and accurate, coordinated Point & Figure and Fibonacci projections -- are combined with other methodologies to bring you weekly reports and frequent daily updates.
“By the Law of Periodical Repetition, everything which has happened once must happen again, and again, and again -- and not capriciously, but at regular periods, and each thing in its own period, not another’s, and each obeying its own law … The same Nature which delights in periodical repetition in the sky is the Nature which orders the affairs of the earth. Let us not underrate the value of that hint.” -- Mark Twain
You may also want to visit the Market Turning Points website to familiarize yourself with my philosophy and strategy.www.marketurningpoints.com
Disclaimer - The above comments about the financial markets are based purely on what I consider to be sound technical analysis principles uncompromised by fundamental considerations. They represent my own opinion and are not meant to be construed as trading or investment advice, but are offered as an analytical point of view which might be of interest to those who follow stock market cycles and technical analysis.
Andre Gratian Archive |
© 2005-2022 http://www.MarketOracle.co.uk - The Market Oracle is a FREE Daily Financial Markets Analysis & Forecasting online publication.