


Is the Gold Bull Market Complete?
Commodities / Gold and Silver 2010 Jun 30, 2010 - 04:33 PM GMTBy: Ronald_Rosen

 Is it conceivable, is it even possible that the gold bull market is complete, finished, and over for this cycle? This REPORT presents evidence that suggests we maintain a cautious attitude towards the gold complex. We know that gold bugs rant and rave about the price exceeding $3,000, $6,000, and now $10,000 an ounce. However, there may, at the very least, be somewhat of a delay and decline before the price of gold reaches those levels (if ever).
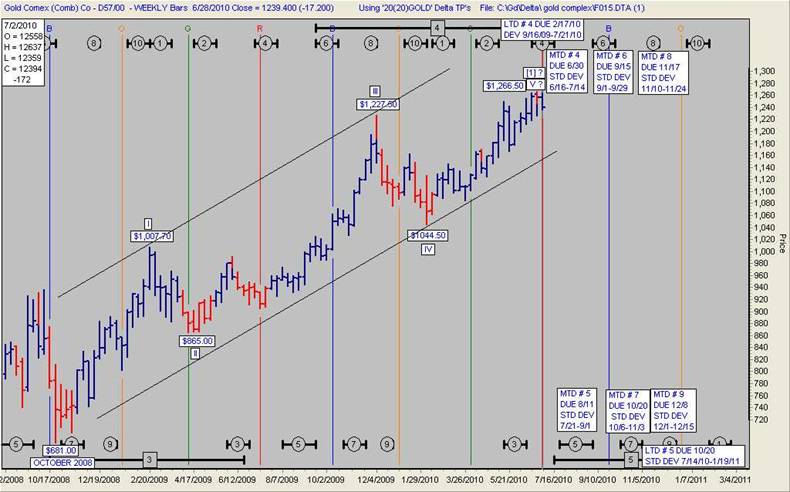
This weekly gold chart shows minor wave [1] of Major Wave Five as being complete. Once the minor wave [2] correction bottoms, the gold bull market should begin to accelerate its rise in minor wave [3] of Major Wave Five. I have been showing this potential wave count which is long term bullish.
GOLD WEEKLY
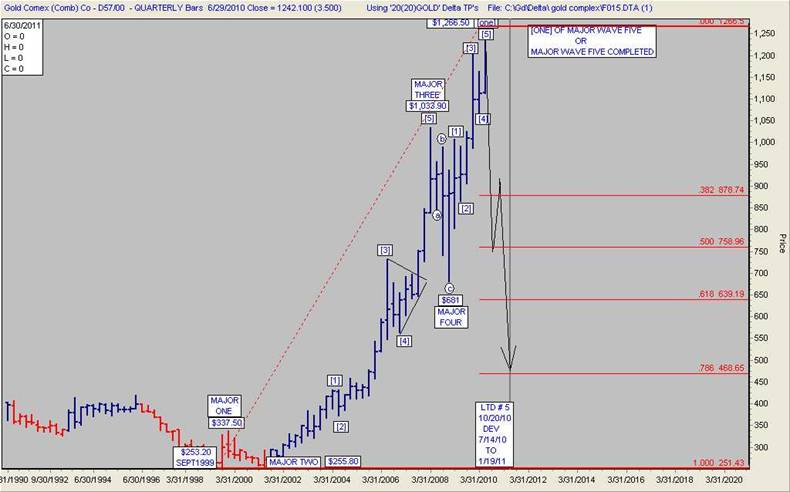
If gold has completed Major Wave Five (as this chart demonstrates) instead of minor wave [1] of Major Wave Five, the decline and selloff could be very dramatic. The extent of the decline would be difficult to predict or project.
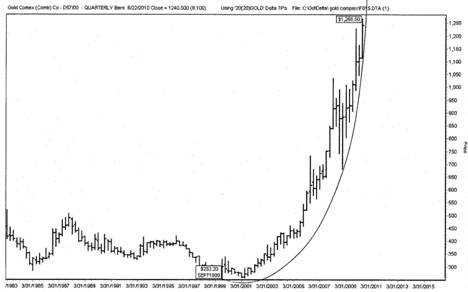
GOLD QUARTERLY
If gold does not continue to rise dramatically in the third quarter the price will break down from the rising French curve that has contained the entire bull market. The curve touches the gold price at the bottom of the previous bear market and two other places on the way up. I can not say that a breakdown from the curve guarantees the end of the bull market. However a breakdown from the curve certainly merits attention.
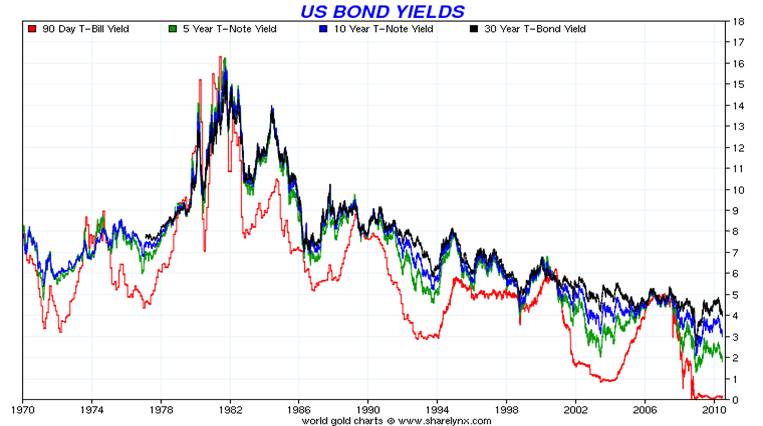
During the bull market in gold from 1970 to 1980 Treasury yields were rising. During the current bull market in gold Treasury yields have been declining.
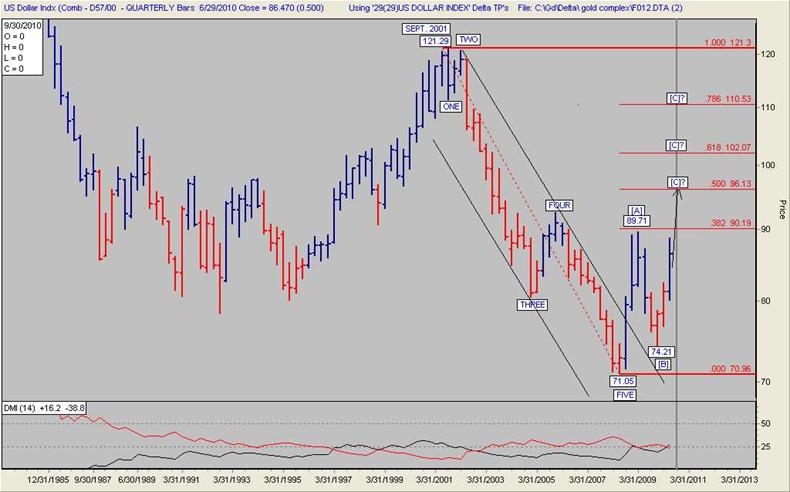
The Dollar Index was bottoming in the 1979/80 period during the final rise in gold. Once gold topped, the Dollar Index then rose dramatically. The Dollar Index has been bottoming during 2009/10. Could gold be repeating or have repeated a topping process as it did in the 1979/80 time frame? The bottoming formations of the Dollar Index do appear somewhat similar. This bottoming process is just about 30 years apart. According to W. D. Gann, “The 30 year cycle is the main cycle, and the minor cycles are proportionate parts of the 30-year cycle or circle.”
GOLD TOP GOLD TOP
DOLLAR BOTTOM DOLLAR BOTTOM
1979 TO 1980 2009 T0 2010???
“The directional movement indicator (also known as the directional movement index - DMI) is a valuable tool for assessing price direction and strength. This indicator was created in 1978 by J. Welles Wilder, who also created the popular relative strength index.DMI tells you when to be long or short. It is especially useful for trend trading strategies because it differentiates between strong and weak trends, allowing the trader to enter only the strongest trends. DMI works on all time frames and can be applied to any underlying vehicle (stocks, mutual funds, exchange-traded funds, futures, commodities and currencies).”
-----------------------------------------------------------
The DMI indicator on this quarterly chart of the Dollar Index does not frequently change trend direction. It has just turned bullish as the black line crossed above the red line. This may indicate that the Dollar Index rally has a lot further to go before it reaches a top.
DOLLAR INDEX QUARTERLY
Welles Wilder’s Delta Turning points for gold, gold shares, the HUI, XAU, silver, silver shares, Dollar Index, stock indexes, and crude oil are available to subscribers. Subscription cost is $30.00 per month.
Subscriptions to the Rosen Market Timing Letter with the Delta Turning Points for gold, silver, stock indices, dollar index, crude oil and many other items are available at: www.wilder-concepts.com/rosenletter.aspx
By Ron Rosen
M I G H T Y I N S P I R I T


Ronald L. Rosen served in the U.S.Navy, with two combat tours Korean War. He later graduated from New York University and became a Registered Representative, stock and commodity broker with Carl M. Loeb, Rhodes & Co. and then Carter, Berlind and Weill. He retired to become private investor and is a director of the Delta Society International
Disclaimer: The contents of this letter represent the opinions of Ronald L. Rosen and Alistair Gilbert Nothing contained herein is intended as investment advice or recommendations for specific investment decisions, and you should not rely on it as such. Ronald L. Rosen and Alistair Gilbert are not registered investment advisors. Information and analysis above are derived from sources and using methods believed to be reliable, but Ronald L. Rosen and Alistair Gilbert cannot accept responsibility for any trading losses you may incur as a result of your reliance on this analysis and will not be held liable for the consequence of reliance upon any opinion or statement contained herein or any omission. Individuals should consult with their broker and personal financial advisors before engaging in any trading activities. Do your own due diligence regarding personal investment decisions.
Ronald Rosen Archive |
© 2005-2022 http://www.MarketOracle.co.uk - The Market Oracle is a FREE Daily Financial Markets Analysis & Forecasting online publication.
Comments
|
Bilal Khan
01 Jul 10, 13:01 |
Welcome back
Where have u been? Please don’t take so long to post again. Really enjoy your work!!!
Bilal Khan |