


Stock Market May Surprise By Year-End
Stock-Markets / Stock Markets 2010 Jul 02, 2010 - 10:32 AM GMTBy: Chris_Ciovacco

 Economic news has been weak lately. Financial markets have performed poorly for over two months. Dow Theory "sell signals" have been issued. You may have heard a "death cross" is on the way. It is nearly impossible to find a bull among the growing sloth of bears. We are concerned about both the fundamentals and the technicals. However, in the context of history the current situation is not all that unusual. Since risk assets, such as global stocks, commodities, and commodity-dependent currencies have very high correlations in today’s liquidity-driven markets, the comments made below relative to stocks also generally apply to copper, silver, oil, emerging market stocks, the Australian dollar, Canadian dollar, risk, etc.
Tepid Recoveries Are Not Uncommon
On the economic front, the Wall Street Journal helps put recent weak economic numbers in some perspective. Stocks did quite well from late 2002 to late 2007. They also did well from 1992 to 1994.
Pauses aren't uncommon early in a recovery. After rebounding from recession in late 2001 and early 2002, the economy had a 12-month stretch in which it grew at a paltry 1.5% annual rate, sparking fears of a double-dip recession. In late 1991, growth waned after a recovery had started. In the past 12 months, the economy has gotten off to a faster start than in 2002.
From CNBC:
Former Federal Reserve Chairman Alan Greenspan said that the recent stock market decline is "typical" of a recovery, and that international instability has more to do with the recent decline than problems in the United States. "What we're looking at is an invisible wall, which we've run into here. Which, essentially, as far as I can see, is a typical pause that occurs in an economic recovery," Greenspan said in an interview with CNBC. "Ordinarily we're saying that the stock market is driven by economic events, I think it's more in the reverse."
Market Correction In Historical Script
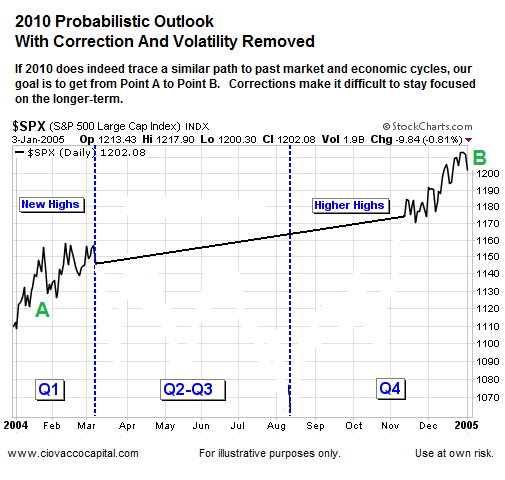
On January 28, 2010, we published the following charts which showed the possible outlook for 2010 based on market and economic cycles. The current correction is not surprising given where we are in the current economic cycle; what is concerning is the way we have corrected (fast with very weak market internals). We are in Q2-Q3 and we are experiencing a "multi-month" correction just as the script called for on January 28, 2010. Since the March 2009 lows, the market has thus far followed the historical script for a recovery closely. It may follow a different path for the balance of 2010, but it is helpful to know the current situation is far from unprecedented.
In the chart below, it is the general market direction and approximate time of year that are relevant, not specific dates or specific percentage changes up or down. The historical bias is for higher highs, a correction, then, further gains as we close out the year.
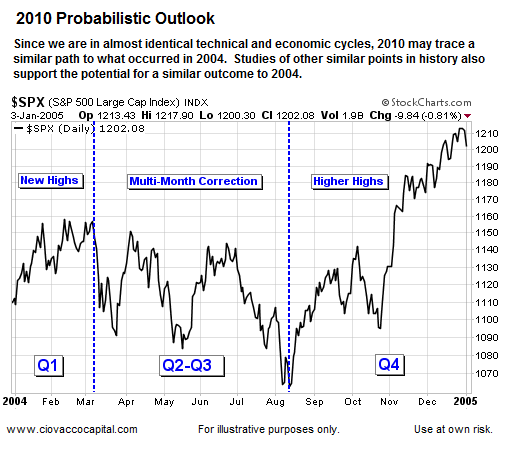
In 2010, year-end values for the S&P 500 could approach 1,300 to 1,350 (1,200 is relevant to 2004, not 2010).
Dow Theory “Sell Signal” – Don’t Panic
You may hear talk or see writings related to a new "Dow Theory sell signal" in the coming days. We follow Dow Theory and believe it is helpful. We also understand like all systems, helpful does not mean perfect. For example, highly respected Richard Russell of Dow Theory Letters issued a "Dow Theory sell signal" on March 10, 2004 with the S&P 500 trading at 1,079. After the signal, the S&P 500 soon rallied back to 1,139 (5.5% higher). The market did go on to make a new low, but it was made at 1,060, only 1.76% below the S&P 500’s level as of the "Dow Theory sell signal". From 1,060, the S&P 500 never looked back and gained 48% (yes 48%) over the next three-plus years. Notice this article is dated March 12, 2004. The current "sell signal" does indicate a weak market, but it must be taken in historical context and in the context of where we are in the current business cycle (a very similar point to March of 2004).
Corrections During Economic Recoveries
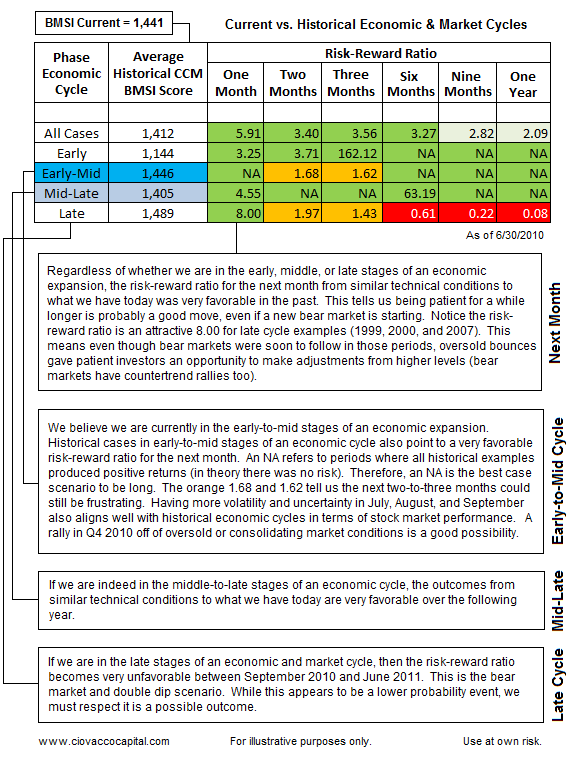
The summary of the analysis below is the market has deteriorated to a neutral position, where markets are walking a fine bull/bear line. Further market and fundamental weakness could move the risk-reward ratio into much less favorable territory. Therefore, the big picture needs to be monitored closely with risk control strategies in hand.
The current CCM Bull Market Sustainability Index (BMSI) score is 1,441, which falls into the neutral range in terms of historical stock market performance. For now, the outlook remains neutral-to-negative for the shorter-term (3 months) and neutral-to-positive for the longer-term (4-12 months).
The table below uses the market’s technical profile, as measured by the CCM BMSI, and fundamental profile, in terms of the business cycle, to examine the stock market’s historical risk reward profile under various circumstances. We are matching the technicals with the stages of the business cycle. The table below shows risk-reward ratios for the S&P 500 based on performance one year after the given technical and fundamental profile. We are looking points in history where the market’s technical profile is similar to what we have today (weak). The risk reward ratios are shown in green, orange, and red (higher ratios are more favorable).
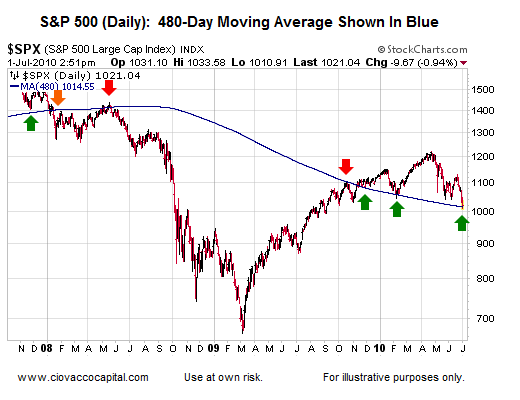
The 480-Day Worth Watching It appears as if the S&P 500's 480-day moving average has been significant since 2008. There is nothing magical about the 480-day; other MAs such as the 500-day may be relevant as well. For the record, the 480-day is at 1,014, 450-day at 997, and the 500-day at 1,024. Notice how prices have behaved near the 480-day MA below (see arrows).
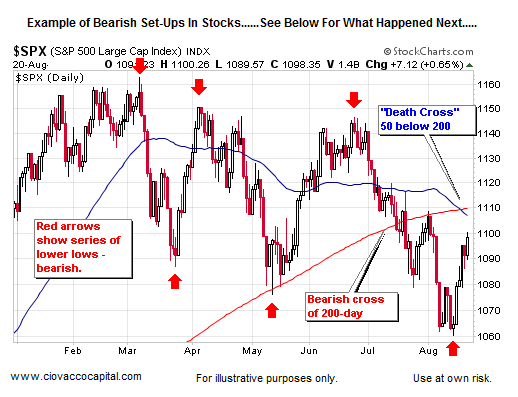
The “Death Cross” Is Not So Deadly
A “death cross” is when the 50-day moving average crosses below the 200-day moving average. The slang term tells you it is not considered to be a bullish signal. It may, and probably will occur soon on the S&P 500's chart. We had similar technical issues in 2004, including a much talked about “death cross”.
The chart below from history illustrates many of the concerns we have about today’s market; lower highs, lower lows, a break of the 200-day moving average, and lots of volatility. At the point in history shown below, many were calling for a "new bear market", and it felt like they were right.
Stocks did not die after the "death cross" in 2004 (it is shown on the bottom left of the chart below). In fact from the corrections lows, the S&P 500 gained 48%.
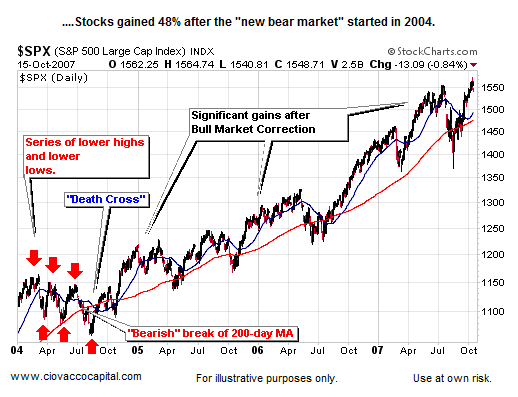
The "death cross" formation historically has resulted in a 0.4% drop in the S&P the month after, but the market traditionally gains nearly 5% in the ensuing six months, according to a Wall Street Journal report Thursday. A 5% gain in six months is hardly "deadly". We agree a "death cross" is not a good thing, and it does indicate a weakening market. However, all technical systems need to be viewed in the light of how the market performed after a signal occurred. A "death cross" is concerning and should be respected, but it does not mean the end of civilization as we know it.
Walking The Fine Bull/Bear Line
The financial markets have deteriorated in a rapid fashion, which is something that needs to be acknowledged and respected. We are at one of those points where you need to be ready to sell, but selling too early could prove very frustrating should the markets recover strongly before year-end. History tells us it may be a difficult two to three months, but all hope is not lost. The markets never make it easy for anyone, which is one script we can all rely on.
Additional comments can be found in Short Takes.
By Chris Ciovacco
Ciovacco Capital Management
Copyright (C) 2009 Ciovacco Capital Management, LLC All Rights Reserved.
Chris Ciovacco is the Chief Investment Officer for Ciovacco Capital Management, LLC. More on the web at www.ciovaccocapital.com
Ciovacco Capital Management, LLC is an independent money management firm based in Atlanta, Georgia. As a registered investment advisor, CCM helps individual investors, large & small; achieve improved investment results via independent research and globally diversified investment portfolios. Since we are a fee-based firm, our only objective is to help you protect and grow your assets. Our long-term, theme-oriented, buy-and-hold approach allows for portfolio rebalancing from time to time to adjust to new opportunities or changing market conditions. When looking at money managers in Atlanta, take a hard look at CCM.
All material presented herein is believed to be reliable but we cannot attest to its accuracy. Investment recommendations may change and readers are urged to check with their investment counselors and tax advisors before making any investment decisions. Opinions expressed in these reports may change without prior notice. This memorandum is based on information available to the public. No representation is made that it is accurate or complete. This memorandum is not an offer to buy or sell or a solicitation of an offer to buy or sell the securities mentioned. The investments discussed or recommended in this report may be unsuitable for investors depending on their specific investment objectives and financial position. Past performance is not necessarily a guide to future performance. The price or value of the investments to which this report relates, either directly or indirectly, may fall or rise against the interest of investors. All prices and yields contained in this report are subject to change without notice. This information is based on hypothetical assumptions and is intended for illustrative purposes only. THERE ARE NO WARRANTIES, EXPRESSED OR IMPLIED, AS TO ACCURACY, COMPLETENESS, OR RESULTS OBTAINED FROM ANY INFORMATION CONTAINED IN THIS ARTICLE. PAST PERFORMANCE DOES NOT GUARANTEE FUTURE RESULTS.
Chris Ciovacco Archive |
© 2005-2022 http://www.MarketOracle.co.uk - The Market Oracle is a FREE Daily Financial Markets Analysis & Forecasting online publication.