


Gold Rally Tracing Bearish Wedge Pattern
Commodities / Gold and Silver 2010 Aug 22, 2010 - 02:22 PM GMTBy: Merv_Burak

 Since its bottom in late July gold has been on an almost steady advance, day after day. However, this advance has traced an upward sloping wedge pattern on the charts and this pattern usually suggests a break to the down side ahead. That could come any day now.
GOLD : LONG TERM
As mentioned a couple of weeks back the new long term P&F chart continues to show gold still trapped inside that up trending channel shown some time back. The action over the past few weeks has provided us with a long term support above the $1155 level but should the price come down to the $1155 price level we would have a bearish break. From the P&F chart standpoint that is the price level to watch. In the mean time the action continues in the up trending channel.
As for our normal indicators, changes happen very slowly. Gold remains above its positive long term moving average line and the momentum indicator remains in its positive zone above a positive trigger line. The volume indicator remains strong and has continued moving further into its all time highs. It also remains above its positive trigger line. The long term rating remains BULLISH.
INTERMEDIATE TERM
On the intermediate term things are a little more complicated, not much, just a little. On the negative side we have the intermediate term momentum indicator continuing to show weaker action on this latest rally than on previous rallies. We can draw a down trend line on the momentum chart that starts at the highest value, that was reached early last Dec, and through the top reached in May and continuing down through the June high and now through the latest action. This down trend line shows the continuing weakening in the momentum action, or as I like to suggest, the strength in the recent price action. At each of these lower points, except this latest one, the gold price was making higher and higher highs. This weakness in the momentum of the price move too often (but not always) results in a reversal of basic price trend. The one unknown is the timing of any reversal. The momentum indicator DOES NOT provide timing, just warning.
Another negative may be seen in the actions of the volume indicator. It is continuing to move higher into its all time high territory BUT the move seems to be very labored. It is moving higher but one can barely see its up trend on a chart. It is almost in a lateral drift rather than an upward move. This most likely reflects the fact that the daily volume action has been very low for the past couple of months despite the upward trend of the gold price. Although at new highs this volume indicator is really not all that positive.
Now for the good news. The price of gold has moved above its intermediate term moving average line after a brief spell below the line. The moving average line has also just turned to the up side. The intermediate term momentum indicator, although showing weakness, has moved into its positive zone and remains above its positive trigger line. The on-going action has placed the rating at the BULLISH level. The short term moving average line has also moved above the intermediate term line this week for confirmation of the bull.
SHORT TERM
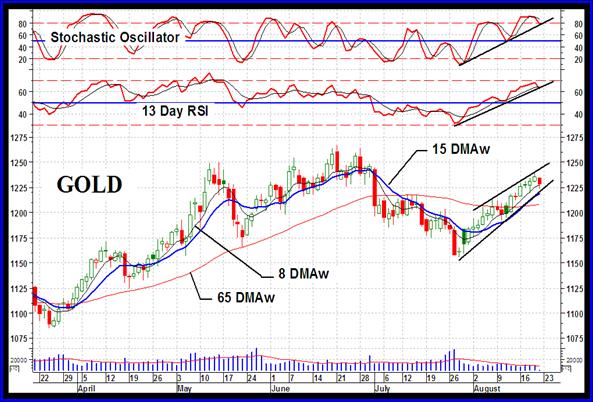
Well, we’ve had a good short term run and now it seems time for a rest or reaction. All of the indicators are pointing to an exhaustion of the advance. We do have well defined up trend lines on the basic price trend and on the short and very short term momentum indicators. In all cases the price or indicator value is sitting right on top of the trend line ready to break below it. That could come on Monday or anytime over the next few days. The price action has also given us an up trending wedge pattern that usually results in a downside break and move to lower levels. As one can see, the daily volume action is nothing short of pathetic compared to the earlier action. We are finally out of the influence of the late July volume action for our short term average volume line and still the volume gets lower. Speculative activity looks like it’s drying up for some reason. Maybe it’s getting ready to burst on the up (or down) side any day now, who knows?
On the plus side for the short term we do have the price action in gold continuing to occur above its positive sloping moving average line. The momentum indicator continues inside its positive zone but has just moved below its trigger line. The trigger, although in a turning mode, has not yet turned to the negative and remains very slightly positive. The short term is still rated, at the end of the Friday close, as BULLISH. The very short term moving average line continues above the short term line for confirmation of this bull.
As for the immediate direction of least resistance, I must go with the down side. Although a good bounce from here is totally possible the immediate trend seems to be to the down side. Although still very slightly above its up trend line the Stochastic Oscillator has now turned downward and has crossed back below its overbought line. In the process it has also moved below its negative trigger line. It does look like gold is getting set for some negative activity, for how long is a good question.
SILVER
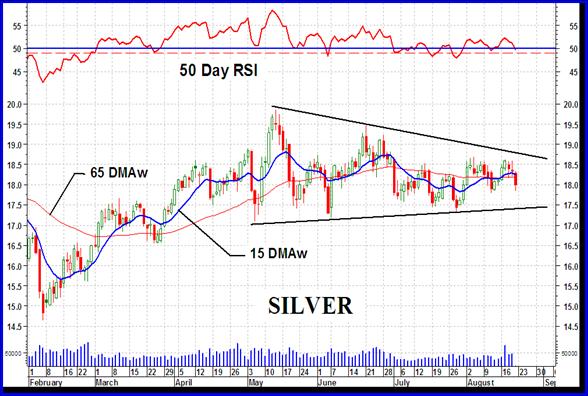
As you can see since the May peak silver has not been acting as well as gold. Gold had made new highs since while silver had not. The last few weeks while gold has been in a steady advance silver has been moving sideways. For this past week gold has advanced some 1.0% while silver has declined by 0.7%. I keep reading how silver is supposed to be a better buy than gold but so far the actions over the past few months do not confirm that position.
The P&F chart often shown here still shows a very solid support for silver above the $17.00 level but a move to $17.00 would be a serious downside break if that should happen. Also, the chart above shows a pennant pattern. Although very elongated it is still a valid pattern. When they are formed following an up trend the usual result is a continuation of the up trend. They are considered continuation patterns. We’ll see what happens here. Sooner or later a move will have to start, it’s just in which direction.
Also well noted by this chart is the fact that after a lengthy lateral period the indicators start to get many whip-saw effects as the price or indicators keep criss-crossing their moving average or neutral lines. For this reason the rating in the table should be taken with some skepticism until a new move gets going. For now the most important technical indicators are the various support/resistance lines and trend lines.
PRECIOUS METAL STOCKS
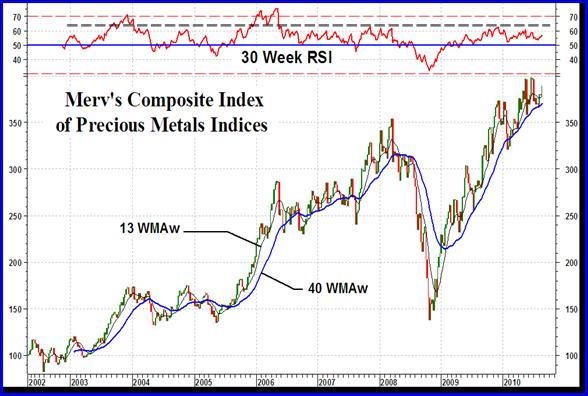
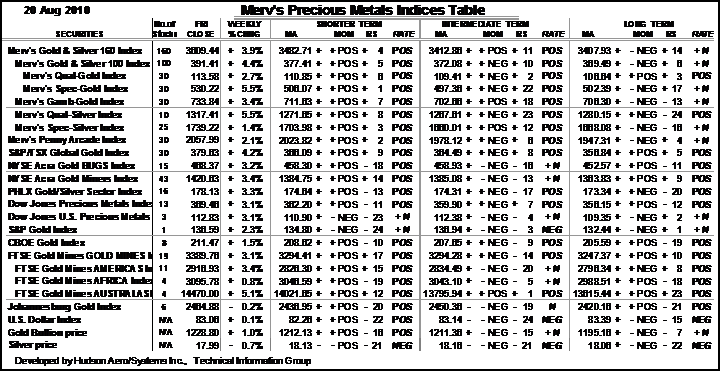
There are many Indices of gold and silver stocks floating around in the industry. I myself have created several. My Merv’s Indices along with several most common Indices are components of my Precious Metals Indices Table posted here on a weekly basis. While generating this table I had also created a Composite Index representing the weekly performance of the Table component Indices. I had been asked from time to time to post this Composite Index occasionally for readers to these commentaries. Well, here it is going back to its creation time. This table represents the average weekly performance of 21 different gold and silver Indices plus the performance of the U.S. dollar, gold and silver prices. Is it any good? Taken along with the long term momentum indicator it does seem to provide us with a better understanding of what’s happening in the precious metal stocks.
There seems to be a ceiling level in the momentum indicator that defines when the Index has reached some exhaustion point. Above the 65% level on the indicator The Composite Index seems to go into overdrive. It seems to be a level where the Index zooms upwards, comes to a halt and moves basically sideways for some length of time. This seems to be the level where we might say that the Index is overbought, rather than the normal 70% level. I’m not really sure how to interpret the fact that for four years now the momentum indicator has not gone into this overbought zone even though we have had some very strong bull moves. It may be that we still are waiting for that period when the Index once more zooms upwards before coming to a halt.
One feature of note if one were comparing this Composite Index with the more popular North American Indices is the fact that the Composite Index is comfortably above its 2008 peak while the North American Indices are not yet above their 2008 peaks. This Composite reflects the performances of the Merv’s Indices which are mostly well above their 2008 highs.
On a closer look at this Index one can visualize a topping process on-going. The new highs of May-June have not been confirmed by the momentum indicator. It had not made similar new highs, showing some weakness in the price move versus the earlier period. How far this will go is yet to be seen.
As for the individual stocks, they had a good week with most on the up side. The best performer in the universe of 160 gained 51.4% on the week while the worst performer lost only 15.8%. There were multiple double digit upside moves while on the down side there were only a very few double digit movers. The weekly emphasis was mostly on the positive side. However, one is still taking large risks on the up side until the Indices overall suggest a better upside climate.
Merv’s Precious Metals Indices Table
Well, that’s it for another week.
By Merv Burak, CMT
Hudson Aero/Systems Inc.
Technical Information Group
for Merv's Precious Metals Central
For DAILY Uranium stock commentary and WEEKLY Uranium market update check out my new Technically Uranium with Merv blog at http://techuranium.blogspot.com .
During the day Merv practices his engineering profession as a Consulting Aerospace Engineer. Once the sun goes down and night descends upon the earth Merv dons his other hat as a Chartered Market Technician ( CMT ) and tries to decipher what's going on in the securities markets. As an underground surveyor in the gold mines of Canada 's Northwest Territories in his youth, Merv has a soft spot for the gold industry and has developed several Gold Indices reflecting different aspects of the industry. As a basically lazy individual Merv's driving focus is to KEEP IT SIMPLE .
To find out more about Merv's various Gold Indices and component stocks, please visit http://preciousmetalscentral.com . There you will find samples of the Indices and their component stocks plus other publications of interest to gold investors.
Before you invest, Always check your market timing with a Qualified Professional Market Technician
Merv Burak Archive |
© 2005-2022 http://www.MarketOracle.co.uk - The Market Oracle is a FREE Daily Financial Markets Analysis & Forecasting online publication.