


Stock Market $SPX, $VIX, and the Elliott Wave Terminal Diagonal Analysis
Stock-Markets / Stock Markets 2010 Sep 13, 2010 - 03:28 AM GMTBy: JD_Rosendahl

 This weekend I'm going to highlight one of the potential stock market patterns. First let's look at the market with a possible Elliott Wave Wedge forming in the wave B position.
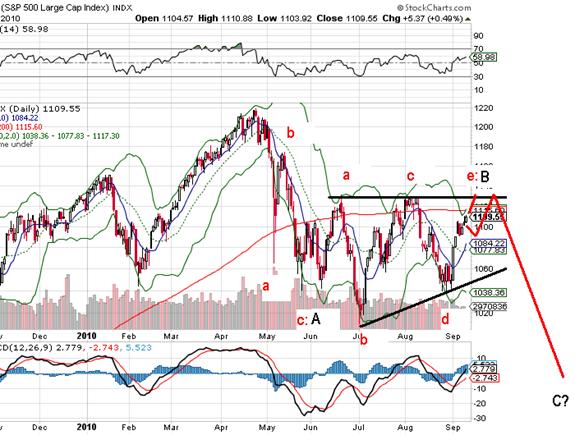
$SPX: We have (abc) down into wave A, and we are forming what looks like (abcde) sideways into what looks like wave B. If this is the case, we could have a little more upside splashing above the 200 day MA and closing a little gap at price resistance. Then, we should expect wave C lower if the structure holds this view. The price target in this view is roughly 930.
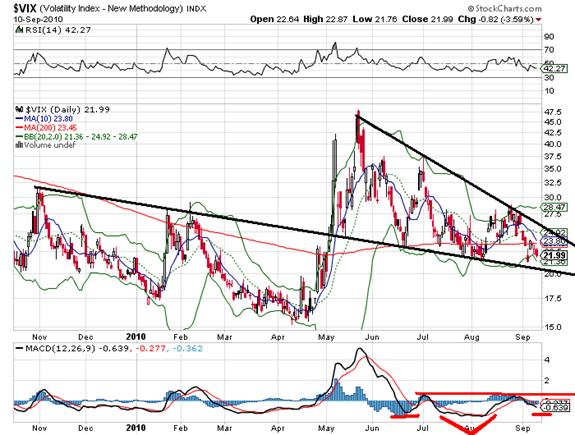
$VIX: If we switch our view to the volatility index we see a declining wedge formation with what looks like another test of the support line coming soon. We should expect this to occur if the $SPX is going to test resistance. The MACD might be forming it's own inverse head and shoulders pattern while price is forming a wedge.
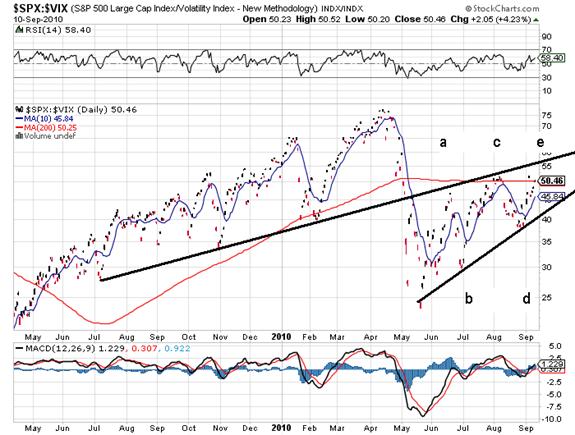
The Risk Chart: One of my favorite charts is the Risk Chart or $SPX/$VIX. It simply prices the market in terms of risk. Periodically, it gives off great signals and it was instrumental in late 2007 in helping us moving completely out of the stock market and to the short side. It's one of two technical reasons my parent's net worth went up in 2008.
Below we see the Risk Chart forming what might be an Elliott Wave Terminal Diagonal pattern. The obvious conclusion is if the stock market tests resistance of the wedge and the $VIX tests the support line then the Risk Chart should push right into the top of the wedge formation and test what is significant price trend resistance. What it does at that juncture could be very important. My potential turn days for that are Sept 16th and 28th based on a Fibonacci count from the recent market low. I like the end of September.
Note: This not something I'm trading at this point, but rather something we should keep our eyes on for the time being. With the various potential bullish and bearish wave counts this could easily turn out to be an exercise of theory.
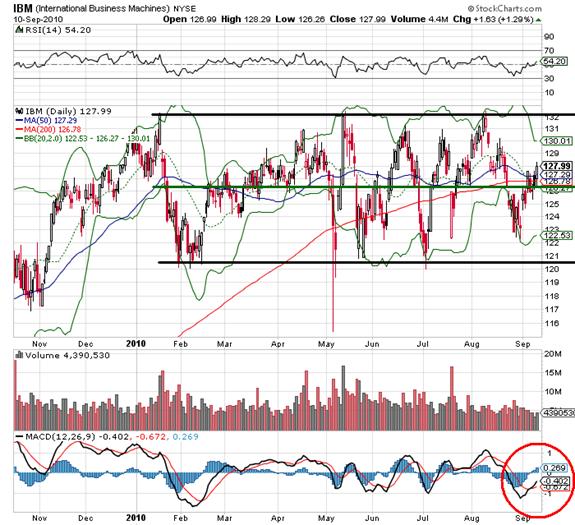
IBM: The stock consolidates right on the 50 and 200 day MAs and pushes higher today. A move above this level adds to the bullish view and the next target is the upper Bollinger Band. I think it moves higher to help push the market towards resistance.
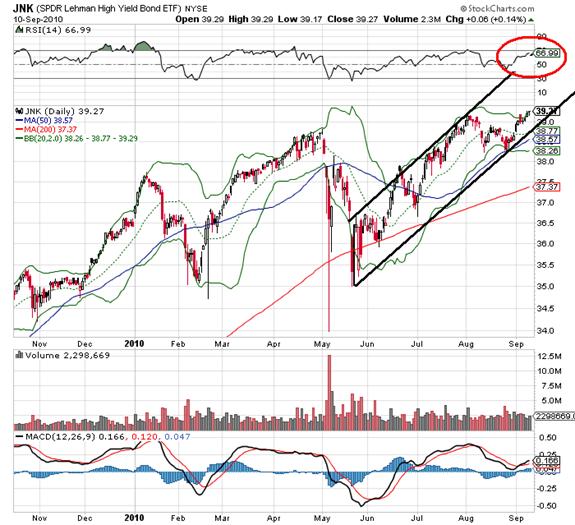
JNK: Still grinding higher as market participants reach for yield which is also a bullish market indicator for the time being. We have a little more room on the RSI. I like the idea of a weak test of the 70 level.
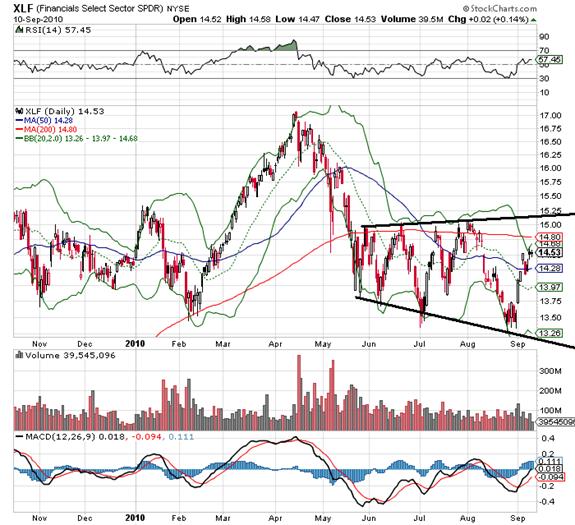
XLF: Starting to look weak with poor volume, but I still think it strikes the 200 day MA and potentially price resistance. If the market is going to fail at resistance and roll over, this will fail also.
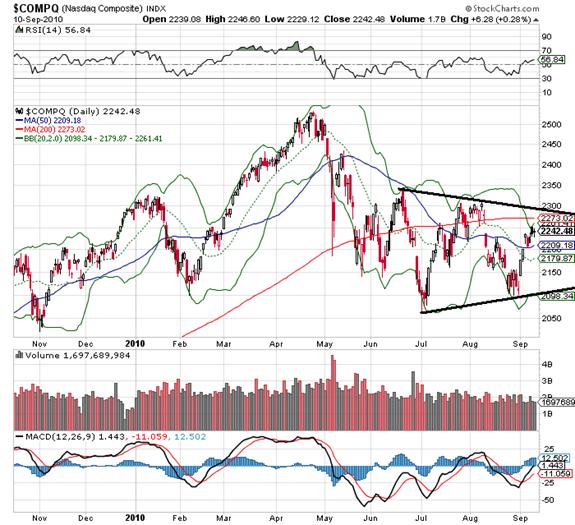
$COMPQ:This has similarities to the XLF. I expect a test of the 200 day MA and the trend resistance line. If the stock market view above is going to happen this should fail at or slightly above the downtrend line.
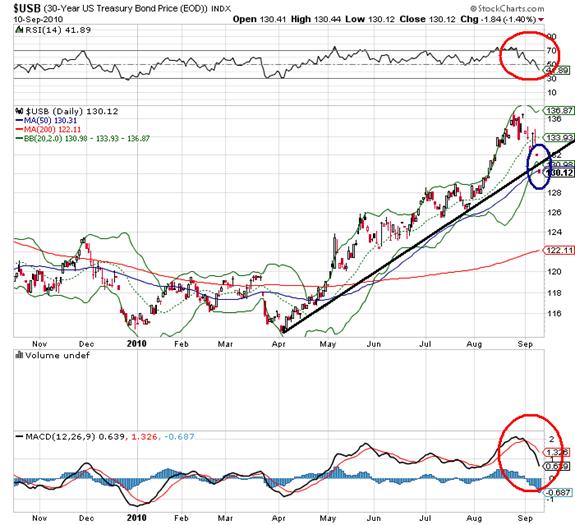
$USB: The bond market has rolled over. While we have no divergences, the RSI and MACD are clearly heading lower and supporting further declines in price. If the stock market is headed higher near term to resistance we should expect the bond market to slide lower. The bond market will have to trade back above the trend line to negate that view.
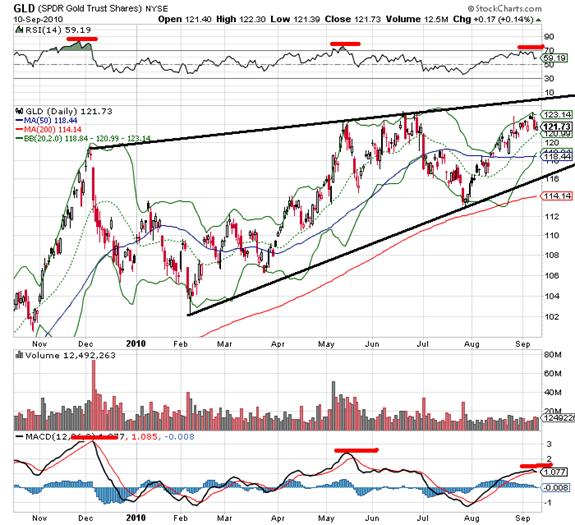
GLD: Tried to rally early Friday but failed. The chart still looks near term bearish. I think we test the lower Bollinger Band and the 50 day MA soon. There still exists the chance of a little push higher, but that's not my primary view. MACD is right there to cross and head lower to support price moving lower.
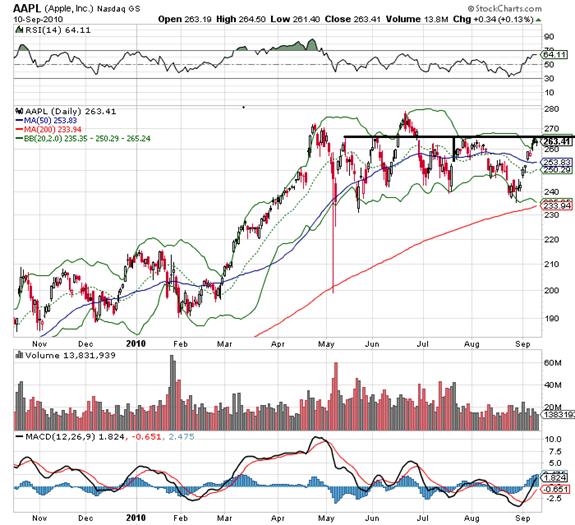
AAPL: I suggested Thursday that AAPL was testing resistance and that was a natural place to stall. We got a little of that Friday.
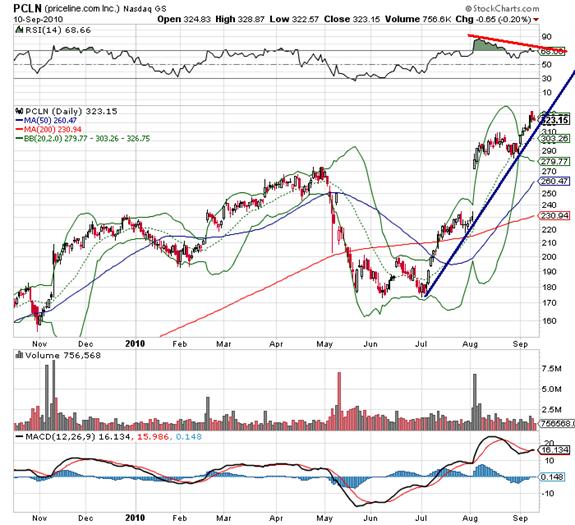
PCLN: Still holding its uptrend line but it's starting to look a little tired.
From My Trading Desk: For my recent trading ideas, please visit www.roseysoutlook@blogspot.com
Hope all is well.
By J.D. Rosendahl
www.roseysoutlook.blogspot.com
J.D. Rosendahl was a former stock broker/investment consultant (currently not licensed) before becoming a Commercial Banker for the past 14 years. He manages his family's wealth, helping them avoid the high tech bubble and the real estate bubble melt downs and preserving wealth.
© 2010 Copyright J.D. Rosendahl - All Rights Reserved
Disclaimer: The above is a matter of opinion provided for general information purposes only and is not intended as investment advice. Information and analysis above are derived from sources and utilising methods believed to be reliable, but we cannot accept responsibility for any losses you may incur as a result of this analysis. Individuals should consult with their personal financial advisors.
© 2005-2022 http://www.MarketOracle.co.uk - The Market Oracle is a FREE Daily Financial Markets Analysis & Forecasting online publication.