


SPX Stocks Bull Market Projection
Stock-Markets / Stocks Bull Market Sep 26, 2010 - 12:41 PM GMTBy: Tony_Caldaro

 After observing this bull market unfold for 18 months it appears to be repeating recent pattern with a few variations. The pattern, as we have discussed before, is similar to the 2002-2007 bull market. That bull market took 60 months to unfold, this one is moving a lot faster. My best estimate, at this stage of the wave structure, is for a top around the previous SPX 1576 high by February 2012. This is how I came up with this projection.
The bull market from Oct02 to Oct07 unfolded in many waves, this bull market is not. The tops of the most significant waves for that bull market, with the time it took for them to unfold, is as follows:
954 2 months
1163 12 months
1229 7 months
1327 12 months
1462 7 months
1556 4 months
1576 2 months
Now a review of this bull market, thus far, displays this data:
956 3 months
1150 6 months
1220 3 months
Notice the first three most significant waves of the previous bull market are very similar to the first three waves of this bull market, with two variations.
First variation.
While the 956/954 waves are similar, the other two took half the time. The 1150/1163 took only 6 months instead of 12, and the 1220/1229 took only 3 months instead of 7. Using the time relationships already established in this bull market I was able to project a top around February 2012.
Second variation.
The OEW pivots during the 2002-2007 bull market were based on the 2000-2002 bear market. The pivots we are using now are a combination of the 2000-2002 bear, the 2002-2007 bull, and the 2007-2009 bear markets. Also, this bull market is following the same price track as the previous one, but it is terminating its waves one pivot below the 2002-2007 bull market. Tricky, but it is clear. Therefore I have some projections in price and time for the rest of the bull market.
1313 Jan 2011 1187 Feb 2011 (9% correction)
1440 May 2011 1313 Jun 2011 (9% correction)
1552 Sept 2011 1291 Dec 2011 (17% correction)
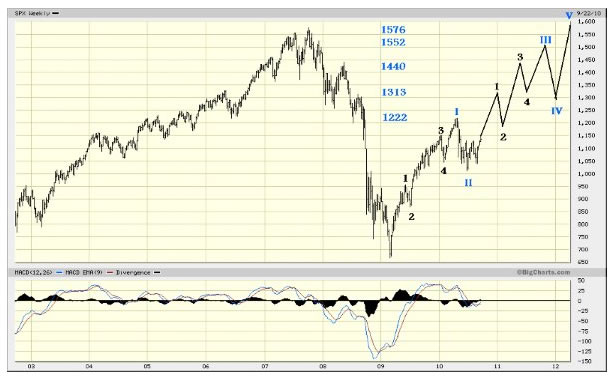
1576 Feb 2012 end of bull market
This is a similar method I used for the “above SPX 1553” projection, for the last bull market, by late 2007. Then, I used the support pivots from the previous bear market, and time relationships based upon the ongoing waves in that bull market. This time, I’m again using the time relationships of the existing waves, but am using the combined resistance pivots from the previous bull market. A slight twist, but it appears appropriate. Chart below:
http://caldaroew.spaces.live.com
After about 40 years of investing in the markets one learns that the markets are constantly changing, not only in price, but in what drives the markets. In the 1960s, the Nifty Fifty were the leaders of the stock market. In the 1970s, stock selection using Technical Analysis was important, as the market stayed with a trading range for the entire decade. In the 1980s, the market finally broke out of it doldrums, as the DOW broke through 1100 in 1982, and launched the greatest bull market on record.
Sharing is an important aspect of a life. Over 100 people have joined our group, from all walks of life, covering twenty three countries across the globe. It's been the most fun I have ever had in the market. Sharing uncommon knowledge, with investors. In hope of aiding them in finding their financial independence.
Copyright © 2010 Tony Caldaro - All Rights Reserved Disclaimer: The above is a matter of opinion provided for general information purposes only and is not intended as investment advice. Information and analysis above are derived from sources and utilising methods believed to be reliable, but we cannot accept responsibility for any losses you may incur as a result of this analysis. Individuals should consult with their personal financial advisors.
© 2005-2022 http://www.MarketOracle.co.uk - The Market Oracle is a FREE Daily Financial Markets Analysis & Forecasting online publication.