


Stock Markets Tentatively Bullish on Economy, Mid-Terms, and Earnings
Stock-Markets / Stock Markets 2010 Sep 27, 2010 - 09:38 AM GMTBy: Chris_Ciovacco

 Last week’s financial market action is trying to incorporate future outcomes related to the economy, mid-term elections, and earnings season, which kicks off with Alcoa on October 7th. Currently, a bullish bias exists relative to these outcomes, but there is little conviction behind the bullish bias.
A study of the markets can give us a good indication of the composite forecast of all market participants. The recent advance in the financial markets, and the S&P 500’s weekly close above 1,131, offers a mixed bag in terms of the market’s outlook. Price, or the value of an index, is always the most important factor to monitor when assessing the conviction of buyers relative to sellers. However, secondary indicators and market volume can help us understand the risks associated with, and the possible sustainability of, any market advance.
The current advance in risk assets should be respected and markets could surprise on the upside. However, the lack of conviction and participation behind the current move puts our assessment into the “cautious and somewhat skeptical” camp. Having exposure to the current move is fine, but diversification and risk control must be part of the equation as well.
As we outlined in Investment Contingency Plans on 9/14/10, we continue to favor a mix of:
- No double-dip / inflation / money-printing assets: Copper (JJC), silver (SLV), gold (GLD), emerging market stocks (EEM), and materials (IYM) (XLB).
- Slow economic growth / more conservative assets: Consumer staples (XLP), utilities with a decent dividend (XLU), and broader based growth indexes.
- Deflation / double-dip assets: While the double-dip scenario remains the lower probability scenario, we must respect it. Having some cash, CDs, dividend-payers, and fixed income exposure can help reduce the risk associated with the holdings above.
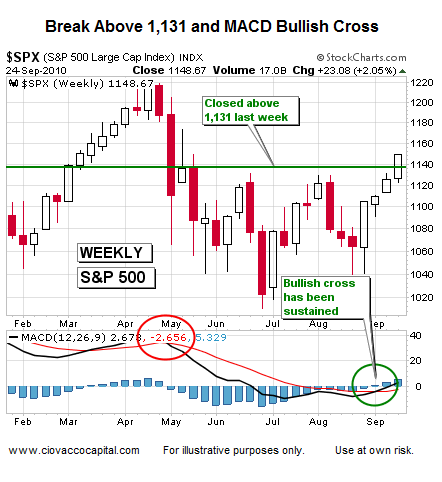
The weekly chart of the S&P 500 shows the clear break above 1,131 last week. The fact that we closed above 1,131 on a weekly basis makes the move more significant. The weekly MACD also has been able to maintain a bullish crossover for a few weeks. Bullish indications on a weekly chart are more significant than those on daily charts since they speak more directly to longer-term market trends and the conviction of buyers vs. sellers.
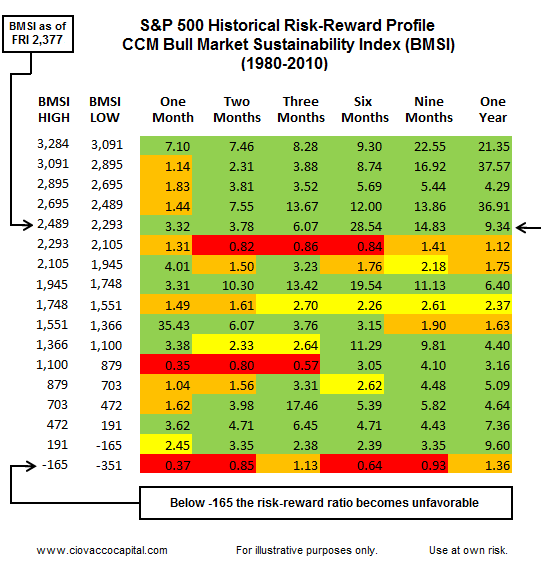
We use the CCM Bull Market Sustainability Index (BMSI) to monitor the market’s overall health. Last week’s action moved the BMSI into the low-end of a very attractive range in terms of the S&P 500’s historical risk-reward profile (see green area in upper-right portion of the BMSI table below). It is possible we slip back down on the BMSI, so the green risk-reward profiles are not a signal to throw all caution to the wind.
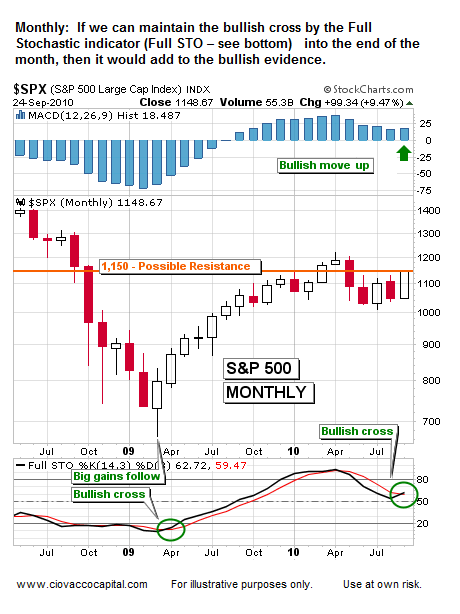
The monthly chart below of the S&P 500 shows two more bullish indications in the forms of the MACD Histogram (top) and Full Stochastics (bottom). Bullish indications on a monthly chart are more significant than those that appear on weekly or daily charts, especially to investors with longer-term time horizons.
By Chris Ciovacco
Ciovacco Capital Management
Copyright (C) 2009 Ciovacco Capital Management, LLC All Rights Reserved.
Chris Ciovacco is the Chief Investment Officer for Ciovacco Capital Management, LLC. More on the web at www.ciovaccocapital.com
Ciovacco Capital Management, LLC is an independent money management firm based in Atlanta, Georgia. As a registered investment advisor, CCM helps individual investors, large & small; achieve improved investment results via independent research and globally diversified investment portfolios. Since we are a fee-based firm, our only objective is to help you protect and grow your assets. Our long-term, theme-oriented, buy-and-hold approach allows for portfolio rebalancing from time to time to adjust to new opportunities or changing market conditions. When looking at money managers in Atlanta, take a hard look at CCM.
All material presented herein is believed to be reliable but we cannot attest to its accuracy. Investment recommendations may change and readers are urged to check with their investment counselors and tax advisors before making any investment decisions. Opinions expressed in these reports may change without prior notice. This memorandum is based on information available to the public. No representation is made that it is accurate or complete. This memorandum is not an offer to buy or sell or a solicitation of an offer to buy or sell the securities mentioned. The investments discussed or recommended in this report may be unsuitable for investors depending on their specific investment objectives and financial position. Past performance is not necessarily a guide to future performance. The price or value of the investments to which this report relates, either directly or indirectly, may fall or rise against the interest of investors. All prices and yields contained in this report are subject to change without notice. This information is based on hypothetical assumptions and is intended for illustrative purposes only. THERE ARE NO WARRANTIES, EXPRESSED OR IMPLIED, AS TO ACCURACY, COMPLETENESS, OR RESULTS OBTAINED FROM ANY INFORMATION CONTAINED IN THIS ARTICLE. PAST PERFORMANCE DOES NOT GUARANTEE FUTURE RESULTS.
Chris Ciovacco Archive |
© 2005-2022 http://www.MarketOracle.co.uk - The Market Oracle is a FREE Daily Financial Markets Analysis & Forecasting online publication.