


Gold a Bubble?
Commodities / Gold and Silver 2010 Sep 27, 2010 - 01:39 PM GMT

 NOT - EVEN - CLOSE - With the number of financial bubbles inflating and bursting over the past decade and a half, it isn’t surprising that financial analysts have their “bubble-dar” honed and active. What is surprising though is the large number who have resoundingly dubbed the gold market as “the next big bubble.” But is it? Most gold owners reject claims that gold is in a bubble, but they might not be sure exactly why. The most concrete and convincing evidence against gold being in a bubble, though, is right in front of us.
In the last 15 years, there have been two generally acknowledged, easily quantifiable bubbles: NASDAQ’s tech bubble in 1999, and the briefer Crude Oil bubble in 2008. (Many would say housing was also a major bubble, but doing so may prove erroneous. Extreme home value loss is limited to certain areas of the country, and is not nearly as conclusive as the tech stock and oil collapses.)
Two characteristics are consistently present in the formation of a bubble. The first is magnitude, and the second is velocity. Long-term advances in prices do not necessarily represent a bubble just because of the duration, and neither does volatility as long as it is within a reasonable range. However, when prices rise sharply in a short period of time, and then drop sharply in an equally short period of time, one can reasonably conclude a bubble formed, and then burst. In other words, when magnitude and velocity combine to cause extreme volatility, that market likely is in a bubble.
Market bubbles defined
This study seeks to define exactly the level of volatility that separates a bubble from a non-bubble. One effective method for quantifying price volatility is to compare the daily price performance of a market against its 200-day moving average.
 |
The 200-day moving average is the longest data set most analysts use when analyzing financial markets, and remains the most widely recognized trend indicator. It is derived by averaging the daily closing price of a market for its most recent 200 days. Because the average changes with each passing day, it is considered to be a moving average. By comparing this data for known bubbles (NASDAQ and Crude Oil) to the same data for a secular bull market (the S&P from 1982-2000), we get a unique, and quite telling, look at magnitude and velocity. The difference in volatility between a bubble and a non-bubble then quickly becomes apparent.
NASDAQ and crude oil bubbles
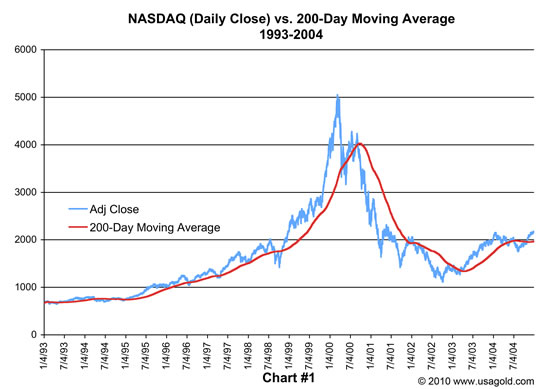
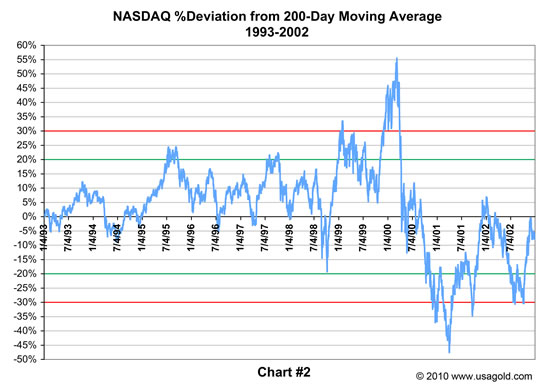
It doesn’t take a degree in finance to look at the price graphs of the NASDAQ and Oil (shown above (Chart #1) and below (Chart #3)) and identify the formation as a bubble. If, however, we measure the daily market closes against their 200-day moving average, a bubble can be identified by applying objective, measurable standards. Chart #2 (below) details the percentage deviation from the 200-day moving average for the NASDAQ during its bubble/bull run of 1993-2002. When the NASDAQ achieved its record close of 5048.62 on March 10, 2000, it was a whopping 55% above its 200-day moving average. The subsequent decline was just as severe. By April of 2001, the NASDAQ had plummeted back to the nominal mark of 1640 -- 48% below its 200-day moving average. The swing in prices was profound. The NASDAQ clearly had both the upside and downside volatility to be categorized as a bubble.
 |
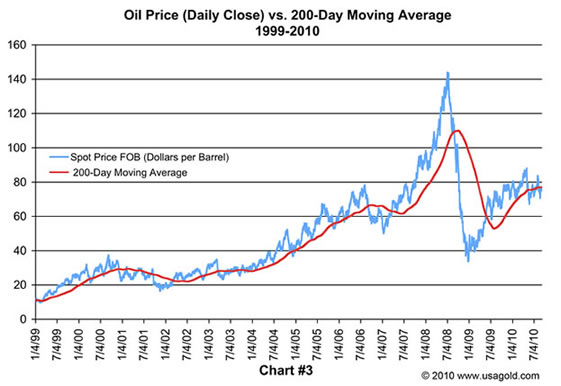
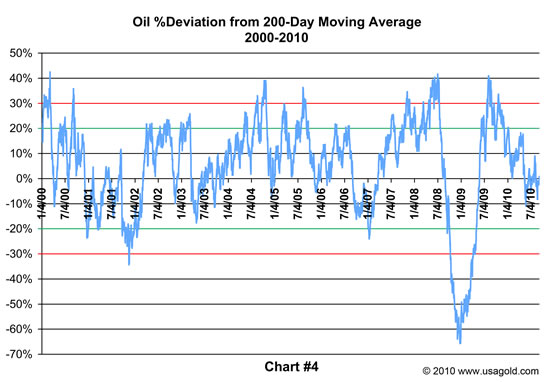
An analysis of price volatility in Crude Oil shows strikingly similar characteristics. In July of 2008 oil prices bolted from the low $60s to an all-time high, exceeding $143 in less than a year (Chart #3). Prices moved so quickly, they were soon 40% above the 200-day moving average (Chart #4). Then the market collapsed. It took less than six months for prices to retrace all the way back to $40 per barrel. In retrospect, oil proved to be a classic example of a market over-correcting as panic-based selling, speculative short sales and bad timing (the financial crisis) converged to eventually drive the price 60% below its 200-day moving average. Oil maintained its head-spinning volatility by recovering from its oversold condition, climbing back to levels 40% above its 200-day MA, before finally stabilizing in price two full years after the initial onset of the bubble.
 |
It should be noted that a very interesting phenomenon occurred in both these markets. After each of these bubbles collapsed, neither, as you can see by the charts(#1 and #3), fell into secular bear markets. Instead both markets had a fairly rapid return to stability near the 200-day moving average, eventually renewing their uptrend from there. In other words, even as both the NASDAQ and Crude Oil inflated into a bubble, each eventually found their way back to stability. And in both cases, that stable price level was the same as the last stable price level prior to the breakout.
 |
The S&P 500 and gold
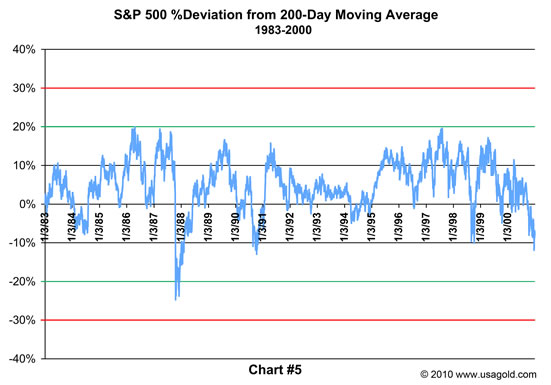
An analysis of the price data for the S&P 500 highlights the key differences between a bubble and a secular bull market. The secular bull market in stocks that lasted from 1982 to October, 2000 never saw sustained a price deviation of more than 20% from the 200-day moving average (Chart #5). In fact, the only period where prices deviated from that range at all was during the market crash of 1987, and even then they only deviated 25% from the 200-day moving average. Moreover, and most importantly, the brief volatility during that crash was followed by a return to price stability near the 200-day moving average almost immediately. For the vast majority of trading days during the S&P’s historic 20-year run, prices fluctuated on the plus side of the 200-day moving average, within a 20% band. The S&P never went straight up, was marked by frequent consolidations, and never experienced significant sustained negative volatility. The result: A steady long-term increase in value and a secular bull market (Chart#6).
 |
 |
So, now. . .the question at hand: Is gold in a bubble? When comparing the graphs for gold to the three markets previously discussed, the answer is nothing short of obvious:
“NOT ---- EVEN ---- CLOSE”
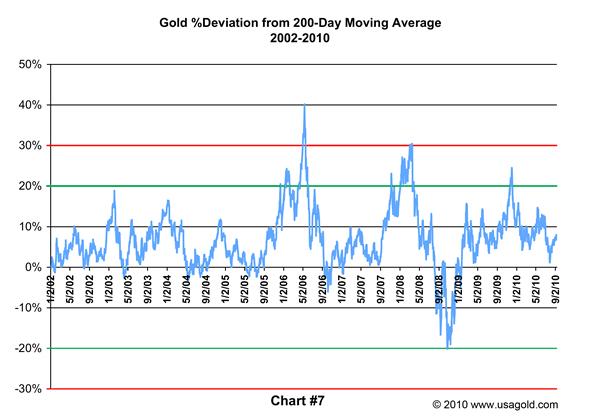
Gold has had only two brief separations from the same stable range enjoyed by the S&P during its secular bull market (Chart #7). The first was in 2006 when prices touched levels 40% above the 200-day moving average. Gold is now almost twice what it was at that juncture ($730 vs. $1290), so hindsight tells us that it was not in a bubble at the time. But how might we have formed that same conclusion in July of 2006 as the gold market quickly retraced to the 200-day moving average?
Simple. After briefly dipping below the 200-day moving average, gold prices stablized, and began marching higher by August of the same year. By simply renewing its uptrend after stabilizing at the 200-day moving average, gold’s price behavior undermined any argument that it might have been in a bubble. Gold eclipsed the $1000 level for the first time during a similar price acceleration in March, 2008. Once again though, the breakout consolidated at just above the 200-day moving average before eventually continuing higher, providing further proof that gold was not in a bubble.
The only sustained activity below the 200-day moving average was during the financial crisis of 2008. Gold, like all asset classes at the time, came under enormous pressure, and prices dipped 20% below the 200-day moving average. In secular bull markets, breaks below the 200-day moving average tend to be few and far between, and typically represent strong buying opportunities. For gold, the low in 2008 represented one of the best buying opportunities in the bull market to date. It only took three months for gold prices to return to, and eventually move past, the 200-day moving average.
 |
Gold’s future - Bubble or secular bull?
All of this, however, represents the past. The question at hand, especially as the chorus of “bubblateers” grows louder, is whether or not gold is in a bubble at current prices. Fortune Magazine tells us to “Beware of the Gold Bubble.” CNNMoney says “Gold: The verdict is in - Major Bubble.” “The current rally in gold could well be unsustainable, with the bubble set to burst at the first sign of weakness," said FXCM Holdings, a foreign exchange broker.
Let’s analyze this “unsustainable” rally. Only once during gold’s recent breakout (the specific breakout that has attracted bubble comparisons) have prices move outside of the desirable 20% band -- even as it has repeatedly set new all-time highs. As was the case in the two previous breakouts already discussed, this price surge in late 2009 was quickly followed by consolidation to within 5% of the 200-day moving average. In fact, gold is already up 20% in price from the bottom of that pullback. More to the point, as gold set a new all-time high at $1290 on September 22, the price was a mere 8.6% above the 200-day moving average!
Needless to say, no one knows with certainty whether or not gold will become “the ultimate bubble” as George Soros recently predicted, or continue in a stable, secular bull market for many years to come. At the present, however, we can be sure of one thing: It is not a bubble at current prices. When comparing gold to the NASDAQ and Crude Oil, gold would have to reach $2042 by year-end 2010 to be deemed a bubble by the same standards. Even then, it would be a completed bubble only if that same price eruption were subsequently matched with an equally sharp decline. Then it would display the kind of volatility required to deem it a true bubble. Even so, if gold’s past price behavior is an indicator, such a decline would eventually correct right back to its last stable range before the price explosion -- the very same range it is trading in now ($1200/oz).
 |
Gold has shown all the chracteristics of a secular bull market in the making over the past eight years - a designation that could carry profound implications on its duration, as well as the price level it ultimately achieves. Returning to the S&P 500’s performance as a template, we see that after roughly tripling its prices in the first six years of its secular bull market, it experienced a 33.5% correction during the crash of 1987 – the only retracement in the bull market move to drive the value more than 20% below the 200-day moving average (Chart #5). This volatile downward spike in prices took the S&P from 337.89 to 225.06. From there, it spent the next 11+ years powering forward, eventually reaching an all-time high of 1520.77, increasing 675% from its low in October of 1987 (Chart #6).
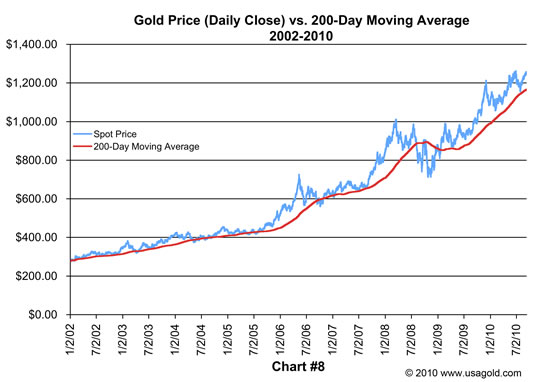
Likewise, gold roughly tripled in the first six years of its bull market. Just as the S&P corrected significantly in 1987, gold experienced a strong pull back in the sixth year of its bull market, coincident with the onset of the credit crisis in 2008. The magnitude of this correction was also remarkably similar to that of the S&P 500, as prices dropped 34% from $1032.20 to $681.65 per ounce. Should gold continue to mirror the S&P 500 secular bull market performance as it has, its upward march would continue through this decade culminating at $4601.10 per ounce – 675% higher than its $681.65 starting point. To put it another way, you don’t need an “ultimate bubble” for things to get really interesting in the gold market.
There are a few more statistics uncovered in the research for this article worth noting:
The average daily price deviation from the 200-day moving average:
• NASDAQ bubble --15%.
• Oil Bubble -- 19%.
• S&P secular bull market -- 6%.
• Gold -- 7%
Percentage of days when prices traded in the desired 0-20% band:
• NASDAQ -- 56%
• Oil -- 44%
• S&P 500 -- 82%
• Gold -- 83%
”NOT ---- EVEN ---- CLOSE”
If you do want to see a bubble in the making, check this out:
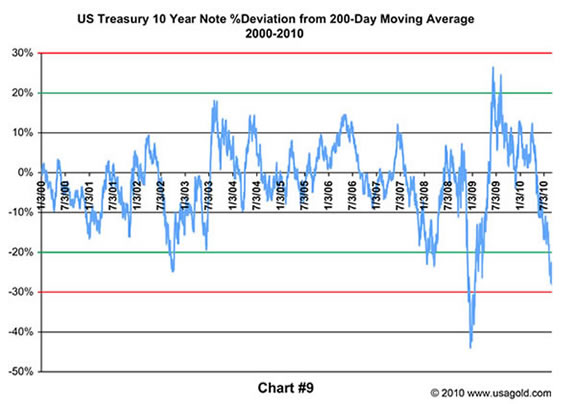 |
Stay tuned to our next issue for my discussion on the developing bubble in U.S. Treasuries, i.e., why its happening, where it might end up, what it means to the prospect of economic recovery, and its relationship to the gold market.
Jonathan Kosares graduated ***** Laude with a degree in Finance from the University of Notre Dame. He has authored numerous articles on the gold market and is the moderator for the USAGOLD Video Series.
Opinions expressed in USAGOLD News, Commentary & Analysis do not constitute an offer to buy or sell, or the solicitation of an offer to buy or sell any precious metals product, nor should they be viewed in any way as investment advice or advice to buy, sell or hold. Centennial Precious Metals, Inc. recommends the purchase of physical precious metals for asset preservation purposes, not speculation. Utilization of these opinions for speculative purposes is neither suggested nor advised. Commentary is strictly for educational purposes, and as such USAGOLD - Centennial Precious Metals does not warrant or guarantee the accuracy, timeliness or completeness of the information found here.
For a free subscription to our newsletters, please click here.
By Michael J. Kosares
Michael J. Kosares , founder and president
USAGOLD - Centennial Precious Metals, Denver
Michael Kosares has over 30 years experience in the gold business, and is the author of The ABCs of Gold Investing: How to Protect and Build Your Wealth with Gold, and numerous magazine and internet articles and essays. He is frequently interviewed in the financial press and is well-known for his on-going commentary on the gold market and its economic, political and financial underpinnings.
Disclaimer: Opinions expressed in commentary e do not constitute an offer to buy or sell, or the solicitation of an offer to buy or sell any precious metals product, nor should they be viewed in any way as investment advice or advice to buy, sell or hold. Centennial Precious Metals, Inc. recommends the purchase of physical precious metals for asset preservation purposes, not speculation. Utilization of these opinions for speculative purposes is neither suggested nor advised. Commentary is strictly for educational purposes, and as such USAGOLD - Centennial Precious Metals does not warrant or guarantee the accuracy, timeliness or completeness of the information found here.
Michael J. Kosares Archive |
© 2005-2022 http://www.MarketOracle.co.uk - The Market Oracle is a FREE Daily Financial Markets Analysis & Forecasting online publication.