


U.S. Dollar Continues to Control Gold, Crude Oil and Stocks
Stock-Markets / Financial Markets 2010 Nov 15, 2010 - 03:04 AM GMTBy: Chris_Vermeulen

 Over the past few months it seems as though everything has been tied to the dollar. Simple inter-market analysis makes it obvious that almost everything in the financial market eventually has an affect on stocks and commodities in some way. But recently trading has really been all about the dollar. If you watch the SP500 and gold prices you will notice at times virtually every tick the dollar makes directly affects the price and direction of gold and the SP500 index.
Let’s take a look at some charts to see the underlying trends and what they are telling us…
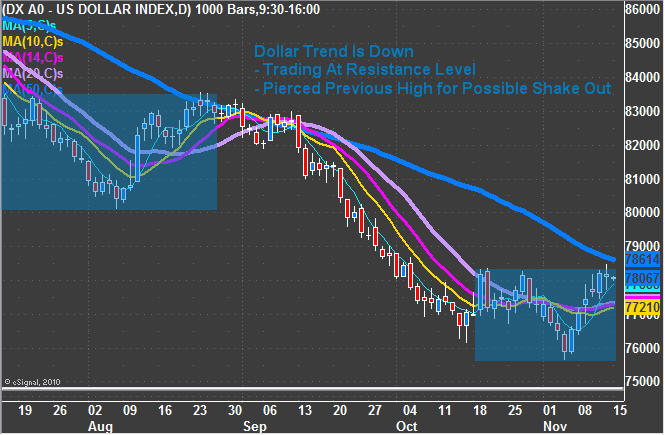
Dollar Index – Daily Chart
As you can see the trend is clearly down. Currently the dollar is trying to find a bottom as it bounces and pierces the previous high. The question everyone wants to know is if the dollar is about to rally and reverse trends or was Friday’s pierce of the October high just a shake out before the next leg down?
Back in late August the dollar pierced the July high on an intraday basis (shake out) just before prices dropped sharply. I think this could very easily happen again but when you see what gold volume is doing, it’s a different story.
Those who follow me closely know I focus on trading with the underlying trend, but manage my risk by trading smaller position sizes when the market has more uncertainty than normal with is what we are currently experiencing.
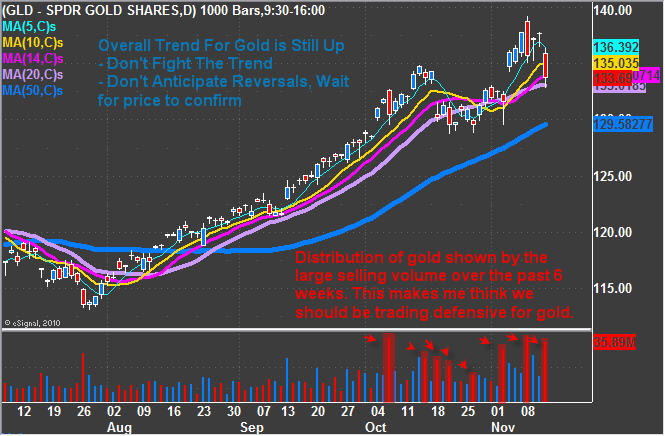
GLD – Gold Fund – Daily Chart
Gold and the dollar are almost inverse charts when comparing the two. Gold happens to be testing a key support level and its going to be interesting to see how the price holds up going forward. The one thing that has me concerned is the amount of selling taking place. The chart shows heavy volume selling and could be warning us of a possible trend change in the dollar, gold, oil and equities in the coming weeks.
Again the trend for gold is still up, so I would not be trying to short it at this time, rather look to buy into dips until the market trend proves us wrong. That being said, with the selling volume giving off a negative vibe and the fact that gold has rallied for such a long time, any new positions should be very small…
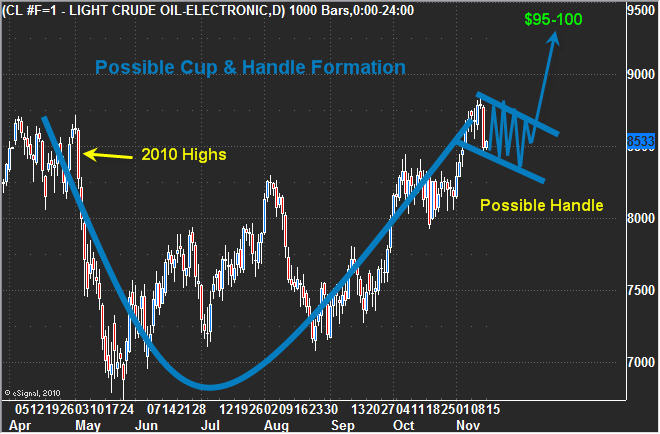
Crude Oil – Daily Chart
Oil looks to be forming a possible cup and handle pattern. If the Dollar continues to consolidate for another 1-3 weeks and breaks down, then we should see the price of oil trade in the range shown on the chart and eventually breakout to the upside. I have a $95-100 price target on oil if the dollar continues to trend down. Until we see some type of handle form here I am not trading oil.
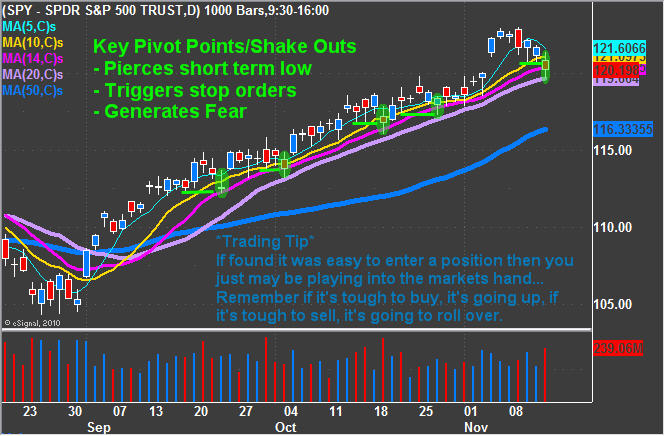
SPY – SP500 Fund – Daily Chart
The equities market looks to have had one of those days which spooked the herd. Friday the price dropped triggering protective stops with rising volume. I was watching the intraday chart as the SP500 broke below the weeks low, and this triggered protective stops which can be seen on the 1 minute charts. In an uptrend I prefer watching stops get triggered because it means traders are getting taking out of long positions and most likely looking to play the short side. When the masses become bearish on the market, that’s when I start looking to play the upside in a bull market (buy the dip).
The chart below clearly shows the days when the shake outs/running of the stops took place. Most traders were exiting their positions and/or going short because the chart looked bearish. One thing I find that helps my trading is that if the chart looks rally scary (bearish) then I start looking at a shorter term time frame for a possible entry point to go long using price and volume analysis.
Weekend Market Trend Trading Conclusion:
In short, I feel the market is at a critical point which will trigger a very strong movement in the coming days or weeks. Because the dollar, gold, oil and the equities market have had such big moves I think trading VERY DEFENSIVE is the only way to play right now. That means trading small position sizes. Right now I am trading 1/8 – 1/4 the amount of capital I generally use on a trade. Meaning if I typically put $40,000 to work, right now I am only taking positions valued at $10,000.
Remember not to anticipate trend reversals by taking a position early. Continue to trade with the underlying trend with small positions or skip a couple setups if you feel strongly of a possible reversal. Once the trend reverses and the volume confirms, only then should you be playing the new trend. Picking tops can be expensive and stressful.
I’d like you to have my ETF Trade Alerts for Low Risk Setups! Get them here: http://www.thegoldandoilguy.com/specialoffer/signup.html
Also Follow Me on Twitter in Real-Time: http://twitter.com/GoldAndOilGuy
By Chris Vermeulen
Chris@TheGoldAndOilGuy.com
Please visit my website for more information. http://www.TheGoldAndOilGuy.com
Chris Vermeulen is Founder of the popular trading site TheGoldAndOilGuy.com. There he shares his highly successful, low-risk trading method. For 6 years Chris has been a leader in teaching others to skillfully trade in gold, oil, and silver in both bull and bear markets. Subscribers to his service depend on Chris' uniquely consistent investment opportunities that carry exceptionally low risk and high return.
This article is intended solely for information purposes. The opinions are those of the author only. Please conduct further research and consult your financial advisor before making any investment/trading decision. No responsibility can be accepted for losses that may result as a consequence of trading on the basis of this analysis.
Chris Vermeulen Archive |
© 2005-2022 http://www.MarketOracle.co.uk - The Market Oracle is a FREE Daily Financial Markets Analysis & Forecasting online publication.