


Panic Selling Hits Stock Market, Silver Is Next!
Stock-Markets / Financial Markets 2011 Jan 20, 2011 - 05:45 AM GMTBy: Chris_Vermeulen

 Today the stock market bled out with a river of red candles. All of the recent gains vanished in one session. Strong selling volume sessions like this are typically a warning sign that distribution selling is starting to enter the market.
Distribution selling is when the big money players start unloading large positions in anticipation of a market top. They do try to hide it by selling into good news or earnings when the average investors are buying into all the hype of better than expected earnings on the news. As average investors jump into the market because of the good news, this extra liquidity helps the big money players (banks, hedge funds, etc..) sell large amounts of their positions to the eager buyers. This is why the “buy on rumor and sell on the news” saying is kicked around wall street….
To me, panic selling is typically seen as a bullish sign to enter the market simply because if everyone is/has rushed to the door to sell what they own, then really most of the down side risk has been taken out of the market. That being said after an extended multi month rally and higher than selling volume I look at it more like distribution selling and a shift in momentum.
I feel the precious metals sector will be starting something like this in the near futures, and possibly it has already started as seen in the rising volume on the down days.
Let’s take a look at the charts…
AAPL – Apple Stock 10 Minute Chart
Two days ago AAPL shares took big hit because of some medical issues with the CEO, the shares did float back up. But what is important here is the distribution selling which took place after Apple came out with much better than expected earnings. The general public loves to buy good news especially when it’s for a famous company. But large sellers stepped in unloading as much of their position as they could before making it look to obvious.
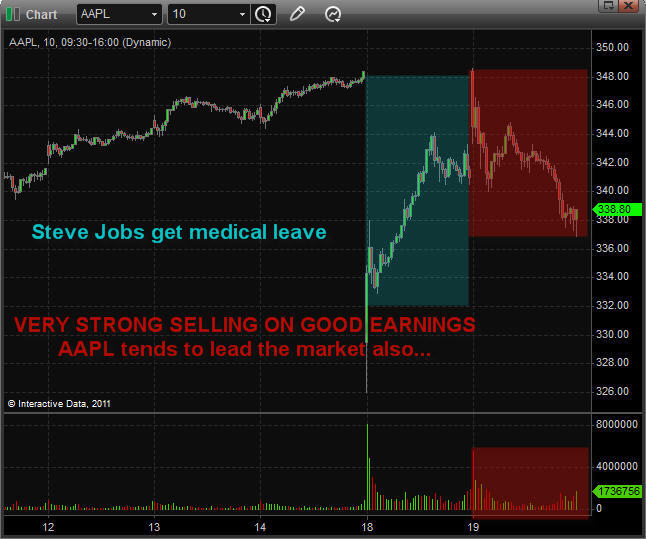
The average investor listening on the radio or catching snippets on the news do not pick up on these things which is why the big money players can get away with this over and over again.
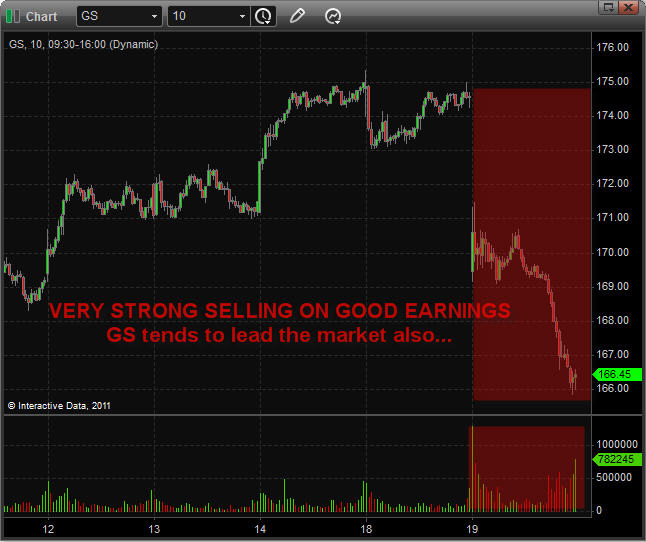
GS - Goldman Sachs 10 Minute Chart
Goldman came out with average earnings being just above estimates and the share price took a beating with very strong volume.
Distribution selling looks to be entering the market and this is a bearish sign. I would not be surprised if we see the market top out in the next 5-10 trading sessions.
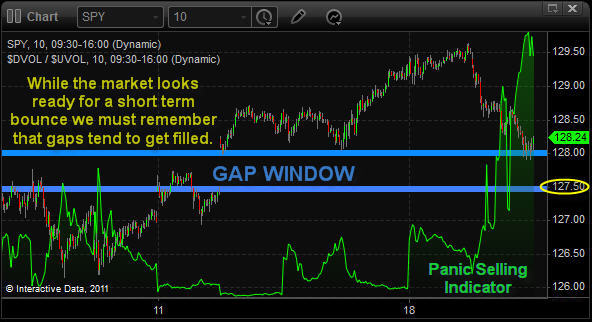
SPY – SP500 10 Minute Chart
Here you can see my green panic selling indicator spiking up much higher than normal dwarfing the past sell off spikes. This makes me think the big money is now starting to unload which will shift the current upward momentum to more of a sideways whipsaw type of price action. Eventually it will roll over and a new down trend will start.
As you can see from this chart the SP500 is trading down at a support level so a bounce is likely going to take place. If in fact today was the first distribution day then the big money should let the price inflate back up to the recent highs and possibly make a new high to help keep investors bullish before the hit their SELL BUTTON again… They like to play these games and understanding them is a key part of trading. Expect choppy price action for a week or two…
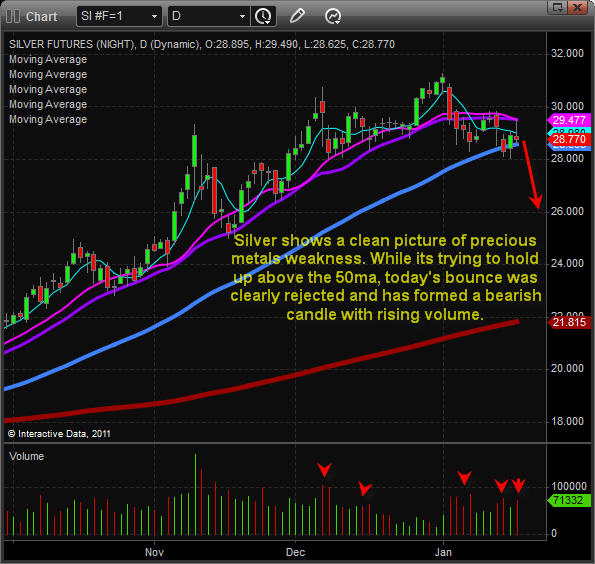
Silver Daily Chart – The Next Wave of Selling?
I look at silver and gold as one… so what I show here is the exact same for gold.
As you can see silver is trading under 3 of its key moving averages and todays bounce was sold into after testing the 14 and 20 period moving averages.
Take a looking at the bottom of the chart and you can see distribution selling volume as the spikes are all down days. If silver breaks below the $28 level then we could easily and quickly see the $26 and maybe even the $24 level.
The Mid-Week Market & Metals Trading Conclusion:
In short, the financial power players are pulling out all the tricks to shake traders out of their positions. A lot of people shorted the market in the past 2 weeks only to get hung out to dry and most likely stopped out of their short positions for a loss. Fortunately we did the opposite taking another long position in the SP500 ETFS because my market internal indicators, market breadth and simple trading strategy clearly pointed out that the average investor was trying to pick a top by shorting the market. As we all know, the market is designed to hurt the masses which is why I focus on the underlying trends, price action, volume and market sentiment for timing trend changes.
That being said, I still think the market could grind higher and make another new high. But any rally or new high will most likely get stepped on with heavy selling. Expect strong selling days followed by a couple days of light volume sessions where the price drifts back up into resistance levels. This could take a week or two to unfold so don’t jump the gun and short yet. It’s best to see more distribution selling before picking a top.
If you would like to get more of my daily analysis to join my newsletter at www.GoldAndOilGuy.com
By Chris Vermeulen
Chris@TheGoldAndOilGuy.com
Please visit my website for more information. http://www.TheGoldAndOilGuy.com
Chris Vermeulen is Founder of the popular trading site TheGoldAndOilGuy.com. There he shares his highly successful, low-risk trading method. For 6 years Chris has been a leader in teaching others to skillfully trade in gold, oil, and silver in both bull and bear markets. Subscribers to his service depend on Chris' uniquely consistent investment opportunities that carry exceptionally low risk and high return.
This article is intended solely for information purposes. The opinions are those of the author only. Please conduct further research and consult your financial advisor before making any investment/trading decision. No responsibility can be accepted for losses that may result as a consequence of trading on the basis of this analysis.
Chris Vermeulen Archive |
© 2005-2022 http://www.MarketOracle.co.uk - The Market Oracle is a FREE Daily Financial Markets Analysis & Forecasting online publication.