


Sharp Drop in Stock Markets - A Mere Correction or Reversal?
Stock-Markets / Elliott Wave Theory Nov 02, 2007 - 02:18 AM GMT

 From its closing high peak on October 9, 2007 , the Dow Jones Industrials spent 8 days in decline and 8 days in a corrective rally. Assuming the up-trend from August to October may be over for now, where may the market go from here?
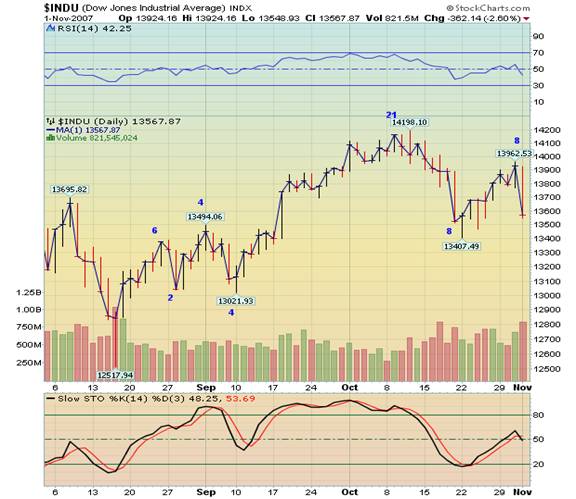
The RSI and Slow Stochastics suggest the decline isn't over yet, so let's have at it to see what may happen next. We may infer from the chart that Fibonacci sequences of days may apply to the advances and declines seen in the Dow Jones Industrials, especially since September 10 th . For the sake of illustration, let's assume the trend of Fibonacci sequences continues through the end of the decline that has begun.
We may label the decline form October 9th (closing basis) to October 19th wave 1 or A. The subsequent rally may be called wave 2 or B. That brings us to the wave just beginning, wave 3 or C. The Elliott Wave Principle, by Frost and Prechter, tells us that both waves 3 and C have a strong personality. They are usually the longest and the strongest of the wave patterns. Since Fibonacci sequences appear in time, let us apply the same sequences in calculating the length of the wave as well. That suggests this downturn may last 8 (it cannot be less that wave 1or A), 13 or 21 days. I favor 13 days, since an important cycle (which I'll call the quarterly cycle) may be bottoming at that time.
That now leaves us the calculation of the distance to the cycle or wave low. Wave 1 or A is 790.61 points in length. We could assume another 790.61-point decline in wave 3 or C that might take the Dow to 13171.92. That would be the minimum decline, since wave 3 or C cannot be smaller.
If wave 3 or C were 1.618 times the length of 1 or A, the decline may take us to 12683.32 in the Dow. Neither of the first two declines would be considered fatal to the longer-term up-trend, since the August low would go unchallenged.
But a third or C wave that is 2.618 times the length of 1 or A would be another matter. It would exceed both of the previous 2007 lows at 11892.71. It may also leave the door open for yet a fifth wave to follow, which wouldn't necessarily be called for in a smaller decline. These examples don't exclude other potential targets for the sell-off, they merely provide a framework for identifying the risk potential.
I'm not in the business of making predictions, so don't label me as a perma-bear. I am simply reporting high probability scenarios. In this case, it might be wise to assume the best and prepare for the worst. If we have just seen the four-year cycle top in mid-October, the subsequent decline could be devastating. The 1987 crash had its worst day on Monday October 19 th . Could Monday, November 19th be referred to as Black Monday as well?
See you on the other side!
By Anthony M. Cherniawski,
President and CIO
http://www.thepracticalinvestor.com
As a State Registered Investment Advisor, The Practical Investor (TPI) manages private client investment portfolios using a proprietary investment strategy created by Chief Investment Officer Tony Cherniawski. Throughout 2000-01, when many investors felt the pain of double digit market losses, TPI successfully navigated the choppy investment waters, creating a profit for our private investment clients. With a focus on preserving assets and capitalizing on opportunities, TPI clients benefited greatly from the TPI strategies, allowing them to stay on track with their life goals
Disclaimer: It is not possible to invest directly into any index. The use of web-linked articles is meant to be informational in nature. It is not intended as an endorsement of their content and does not necessarily reflect the opinion of Anthony M. Cherniawski or The Practical Investor, LLC.
Anthony M. Cherniawski Archive |
© 2005-2022 http://www.MarketOracle.co.uk - The Market Oracle is a FREE Daily Financial Markets Analysis & Forecasting online publication.