


Fibonacci and the Pricing Mechanism of Financial Markets, S&P500 and US Bonds
Stock-Markets / Financial Markets 2011 Feb 26, 2011 - 05:53 AM GMT

 Evidence is mounting that the pricing mechanism of global markets creates spontaneous order out of the chaos of billions of people pursuing their self-interested purpose. Arriving at a price for products, services and financial assets is the heart of this process. There are successes and failures in every round of pricing, which are priced into the next cycle of human action in global markets.
Unlike the unemployment rate, CPI, GDP and other numbers reported by governments in the U.S. and around the world, the trades of financial assets in financial markets are real numbers, done deals, not adjusted government statistics. That is why so are compelled to study financial market prices to figure out what actions they should be taking to execute their plan, improve their lot and insure their future.
There is innately a greater trust in the pricing numbers produced by the free market activity by investors and traders than government statistics. The intent here is not to belittle government statisticians, they have a role and serve a purpose, but to understand what is going to happen next in the world, you have to study market prices. Market prices are the real McCoy in human action.
If you are looking for rhyme and reason in your business or financial life, like what is coming next, government statistics are not the place to start. Market prices contain the keys to discovering value and forecasting the future. Sure, the Federal Reserve may supply liquidity to markets that impact prices, even trillions in liquidity, but buyers and sellers still have to agree on prices for stocks, bonds, commodities and gold to make the trade. Prices in markets are the crumb trails of human action in pursuit of the discovery of value and self-interested purpose.
Studying trades at exact prices between buyers and sellers in financial markets provides the ability to understand how the price mechanism of markets directs the destiny of the greater global economy. Markets confirm what is valued and what is not. Markets are the fingerprints of the invisible hand that directs buyers and sellers to come to terms. Price plays an important role in discovering the future for businesses, individuals and the global economy.
In a recent article, The Edge of Chaos, I examined the thinking of free market Nobel economists Fredrick Hayek for insights into markets as complex systems that provide spontaneous order out of the chaos of human activity. Hayek’s ideas are important because they suggest that free markets create a stable domain between the worlds of anarchy on one hand and the sure decay of central planning on the other, two extremes that currently threaten to tear the world apart and hamper your ability to discover your destiny. Yes, you do have a destiny, and smooth running free markets help you discover it. Central planning that distorts the pricing mechanism of markets is the enemy of peace and prosperity. Central planning promotes chaos, not order.
If you buy Hayek’s reasoning, then the questions concerning how markets produce spontaneous order are reasonable. What exactly does spontaneous order look like? Any observer of market price movements that has studied stock, currency, commodity or bond markets has likely marveled at the influence Fibonacci ratios exert on price discovery in markets.
Fibonacci ratios clearly exert a force on the pricing mechanism of markets as market participants engage in recurring rounds of trading around the globe. New discoveries of Fibonacci ratio price relationships reveal the pricing mechanisms of markets. In fact, Fibonacci ratios appear to be the heart and soul of the pricing mechanism of markets. Market participants innately or directly use Fibonacci ratios to determine when prices are too high or too low. Investors and traders that are not aware of the Fibonacci grids that guide price action in markets are handicapped in their investing and trading.
The concept to the Fibonacci Dynamic Web in markets comes from the work of the late market timer PQ Wall. However, PQ did not utilize Fibonacci ratios. He would begin with zero as his baseline price and then pick an important market high. He divided the entire market move by three, i.e. three 33% moves, and then drill into the sub-levels of the market prices, dividing each third or by three again. The three sections of any level he labeled as Solitude, Normal and Frenzy, to describe the character of the market in these ranges. PQ would drill down to deeper levels of this Dynamic Web in any market. He used this method to describe the Dynamic Web of price action in markets.
The 33% ratio is a Fibonacci ratio, since both 1 and 3 are Fibonacci sequence numbers, but 33% is far from the most powerful Fibonacci ratio. PQ did not use 33% with the intent of applying it as a Fibonacci ratio, but as a reflection of this view of the inherent threeness in market activity. He viewed market price as struggling between these three ranges of Solitude, Normal and Frenzy in perpetual disequilibrium.
Searching for a more functional Fibonacci Dynamic Web method that produced more “hits” on market turns, I took the most important intraday market low and the most important intraday market high produce the Level 1 price range in the Fibonacci Dynamic Web grids. Instead of dividing by three, I created a grid with all the Fibonacci ratios between 0% and 100% and include their compliments, i.e. the 23.6% ratio produces the 76.4% compliment ratio. The 76.4% target is 23.6% short of the 100% target. The method produces a balanced grid of the entire price move. The ratio compliments prove to exert just as much force on the market as the actual Fibonacci ratios. The results and the insight this method provides into the market pricing mechanism are stunning.
In our Fibonacci Dynamic Web work at LongWaveDynamics.com, the price range of 0% to 38.2% is the Solitude range, 38.2% to 61.85 is the Normal range, and 61.8% to 100% is the Frenzy range of prices at all levels in a Fibonacci Dynamic Web grid drill-down into a market. Note that the golden and inverse golden ratios divide the ranges instead of 33%. When you take any two adjacent Fibonacci ratios in the grid and make them the 0% and 100% targets in a new grid, you can generate a Level 2 price grid. Prices in financial assets, such as individual stocks, commodities, bonds and gold, consistently turn at key levels in the Fibonacci Dynamic Web price grids. This is true from Level 1 down to the smallest relevant range of Level 4 or lower. In our work, we drop the 50% to generate the next level of grids, since it is not in the sequential ratios, but print the 50% since it is a Fibonacci ratio and exerts an influence on market prices.
Any student of market prices and the power of Fibonacci, and you should be if you are an investor or trader, will be amazed at the power of this method of analysis. Clearly, the Fibonacci Dynamic Web of price activity is central to global markets functioning to produce spontaneous order from chaos. This spontaneous order in market prices sends messages to investors and producers, informing them how best to deploy their resources to meet market needs.
Below, the S&P 500 demonstrates the Fibonacci Dynamic Web drill-down method. It is important to use the most important low and high for the Level 1 grid. In the grids presented, the intraday low in 1982 and the intraday high in 2007 produce the Level 1 grid. The most obvious features on this chart are the March 2009 low at the 38.2% target and the July 2010 low at the golden ratio 61.8% in the Level 1 grid.
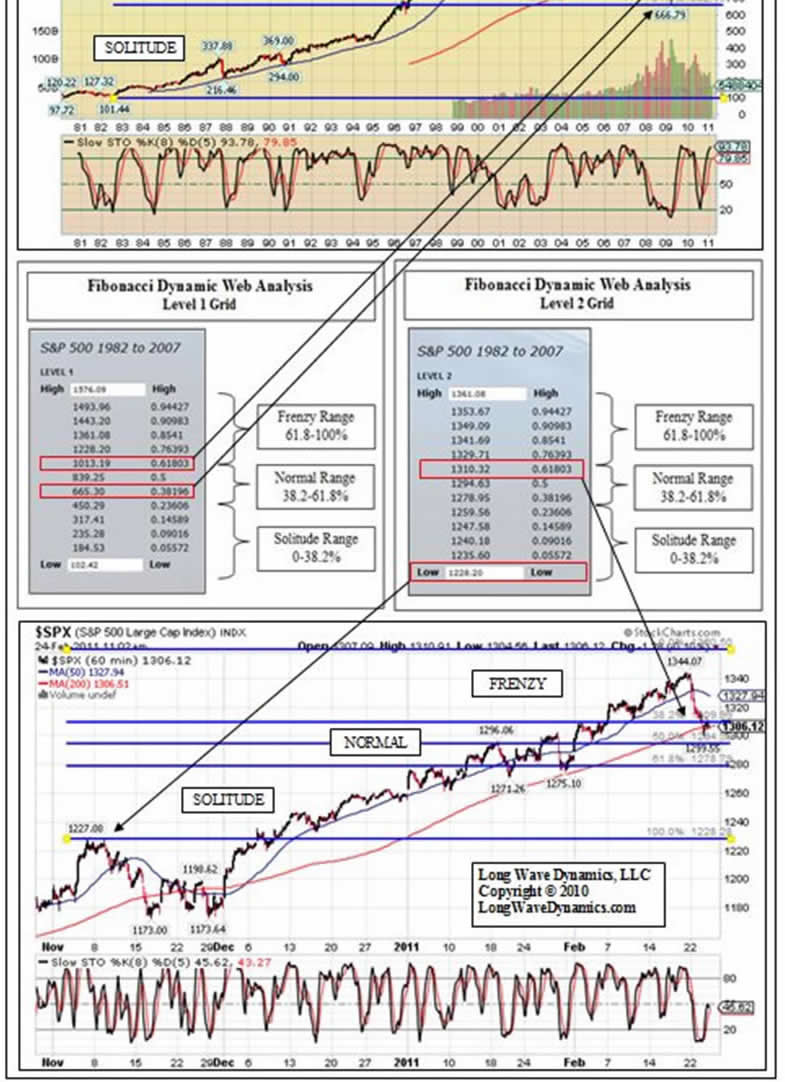
Reviewing the Level 2 grid above, the most relevant observation is that the November high was at the low in the current Level 2 grid at 1228, which is also the 76.4% Level 1 target. More importantly, right now the S&P is struggling to stay above the 1310.32 golden ratio target in the Level 2 grid. When golden and inverse golden ratios fail in a Level 1 or Level 2 grid, cycles are typically in an important transition phase. This one is in danger of failing when the Fibonacci times cycles are indicating an overdue date for a cycle ending in time. This Level 2 grid is also important because the low in this grid at 1228 is a candidate to stop the decline of the current Wall cycle. When 1228 caves, the post March 2009 rally will be in trouble.
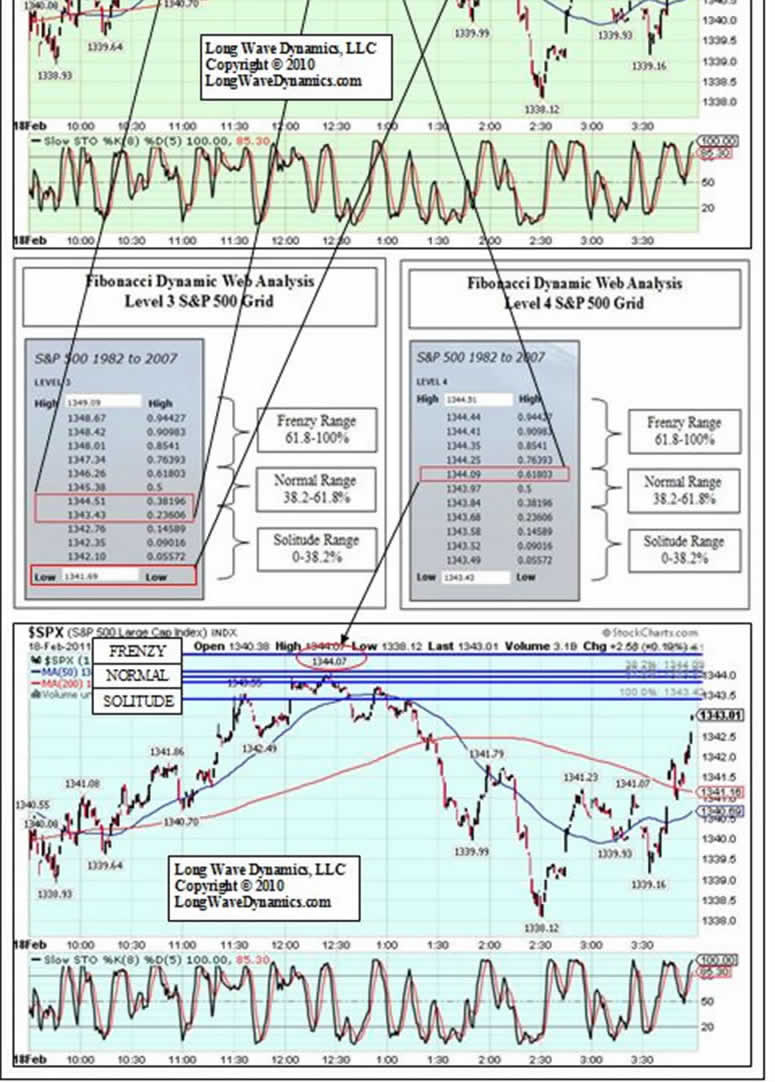
Contemplating the Level 3 grid below, it is worth noting that Mr. Market was not able to break out of the Solitude range, over the 38.2% target, and into the Normal range. It failed between the 23.6% target and the 38.2% target in the Solitude range of the Level 3 grid. The Level 4 grid is of interest because the market failed two cents shy of the golden ratio in the Level 4 grid. It could not break into the Frenzy range of the Level 4 grid, and make a run for the Normal range in the Level 3 grid.
The Fibonacci Dynamic Web ranges reveal a great deal about the price progress of a given security or market. The Fibonacci Dynamic Web drill-down grids reveal a portion of the spontaneous order that lies under the surface of markets. Fibonacci ratios are somehow central to the pricing mechanism of markets as complex systems. Markets forge order out of chaos. Investors and traders can track the price of any stock, index, commodity, bond, currency, currency pairs or even gold using the Fibonacci Dynamic Web drill-down grid approach.
The price turns governed by the Fibonacci targets in these drill-down grids will change your view of market analysis forever. Technical analysis can be combined with fundamental analysis to determine the right price and time to make the right investment. The objective is to use the Fibonacci Dynamic Web grids for entry, exit and stop loss strategy. The Fibonacci Dynamic Web approach can be combined with other methods, providing actionable information to investors and traders.
The Fibonacci Dynamic Web drill-down grid approach can also be used to generate price projection grids into the future. If a market, such as gold, is hitting new highs, there is not an important high price to use in the Level 1 grid. In this case an important past move can be used as a Fibonacci ratio of a future move. Taking that full move you can then drill into those grids and observe the grid price action.
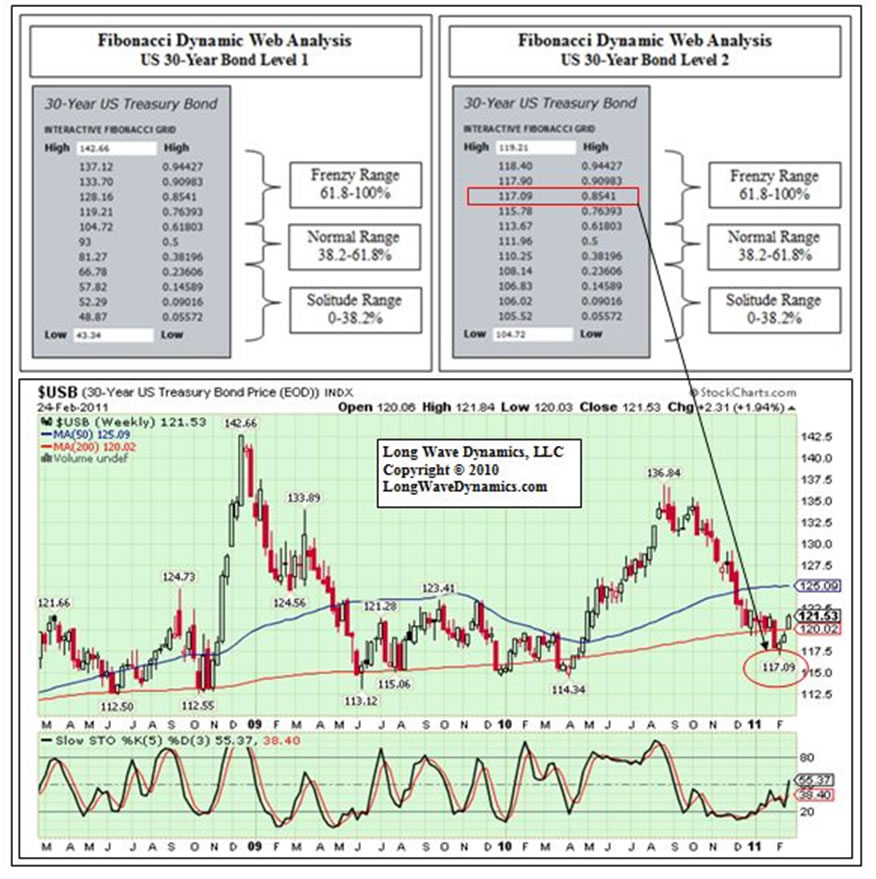
Another example of the power of the Fibonacci Dynamic Web method is that the U.S. 30-year bond rallied in January off the exact 85.41% target in the Level 2 grid at 117.09, and has rallied back over the next Level 1 target at 119.21. The Level 1 grid low comes from the 1981 low, the Level 1 high is the 2008 high. The colossal U.S. debt market holds the key to the resolution of the current Kondratieff long wave winter season. If the golden ratio in the Level 2 grid at 113.67 caves, and the U.S. 30-Year drops out of the Frenzy range of the Level 2 grid, then the central planning of central banks that is attempting to highjack the pricing mechanism of markets, and inflate away the global debt problem, may be working. Of course, the downside is that it is spreading chaos around the globe. If the 30-year bond keeps rallying, the risk-off global deflationary scenario remains in play.
Fibonacci ratios are also active in the cycle time grids. The long wave, long wave season, Kitchin cycle and Wall cycle, are also guided by Fibonacci ratios in time as well as price. Combining Fibonacci ratios in time and price will open your eyes to the power of market cycle analysis. Tracking market cycle dynamics in price and time allows investors and traders to reduce their risks and improve their returns.
David Knox Barker is a long wave analyst, technical market analyst, world-systems analyst and author of Jubilee on Wall Street; An Optimistic Look at the Global Financial Crash, Updated and Expanded Edition (2009). He is the founder of LongWaveDynamics.com, and the publisher and editor of The Long Wave Dynamics Letter and the LWD Weekly Update Blog. Barker has studied and researched the Kondratieff long wave “Jubilee” cycle for over 25 years. He is one of the world’s foremost experts on the economic long wave. Barker was also founder and CEO for ten years from 1997 to 2007 of a successful life sciences research and marketing services company, serving a majority of the top 20 global life science companies. Barker holds a bachelor’s degree in finance and a master’s degree in political science. He enjoys reading, running and discussing big ideas with family and friends.
© 2011 Copyright David Knox Barker - All Rights Reserved Disclaimer: The above is a matter of opinion provided for general information purposes only and is not intended as investment advice. Information and analysis above are derived from sources and utilising methods believed to be reliable, but we cannot accept responsibility for any losses you may incur as a result of this analysis. Individuals should consult with their personal financial advisors.
© 2005-2022 http://www.MarketOracle.co.uk - The Market Oracle is a FREE Daily Financial Markets Analysis & Forecasting online publication.