


Sun Spots Solar Activity and the Financial Markets Part II
Stock-Markets / Financial Markets 2011 Apr 04, 2011 - 05:09 AM GMTBy: John_Hampson

 If you have not already read the first part of my analysis on Solar Activity and the Financial Markets, please do so here, as it provides important background for part II.
In that article I provided evidence that rising solar activity into a solar peak is correlated with periods of inflation and that in historical secular commodities bull markets the relative pricing of hard assets to stocks has each time peaked at the solar peak. Commodities are sought after in inflationary times and their prices are a key ingredient in consumer price inflation levels, producing a feedback loop, but given that stocks also usually perform well in inflationary times is there any correlation between stocks and solar cycles?
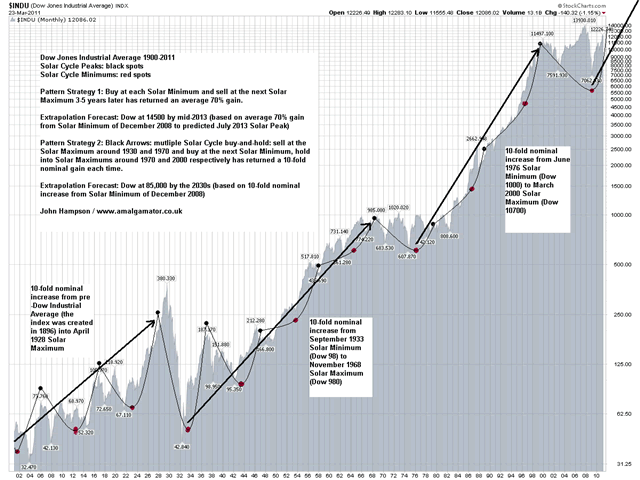
Below is a long term Dow Jones Industrial Average stock index chart, with solar peaks marked as black spots and solar minimums as red spots. Click here for a larger image.
It is immediately apparent that solar peaks show some correlation with peaks in stocks. In fact, buying at each solar minimum and selling at the next maximum (3-5 years later) has returned average gains of 70%.
An even better strategy would have been buying and holding stocks over multiple solar cycles, being out of the market specifically for just a half-cycle around 1930 and 1970. This strategy returned 10-fold gains each time measured from solar minimum to solar maximum over a multi-decade period. Pattern continuation would imply that the half-solar-cycle from March 2000 to December 2008 set up a potential 10-fold increase from the December 2008 solar minimum to a Dow level of around 85,000 by the 2030s (and that the March 2009 low was the definitive low). If that target seems excessive, then bear in mind that this is the nominal Dow, not real inflation-adjusted, and that such an increase would only be in line with history. That timescale would also fit well with an average secular stocks bull between the 2010s and 2030s, powered by technological paradigm shifts from AI, nanotech, biotech, geoengineering, alternative energy, or other fields. Consider that technological evolution is exponential in pace and the last secular stocks bull delivered internet, mobile phones, DNA indentification, fibre optics and more.
Here is the data supporting the shorter term strategy of buying at solar minimums and selling at the next cycle maximum for an average 70% gain:
Why might stocks consistently outperform in these periods from solar minimum to maximum, and underperform from solar peak down to the next solar minimum, particularly as higher solar activity can cause higher geomagnetism on Earth which affects humans biologically negatively and adversely affects stock market returns (see first article)?
Well, there is a slight lag in geomagnetic peaks after solar cycle peaks, as shown below, and this fits well with why we have seen an economic recession follow each solar cycle maximum in the last century - it corresponds to the peak in geomagnetism. Historically, this post-solar-peak period has been one of human apathy and peace. Conversely, the period into the solar peak has been one of human excitability, pro-action and economic inflation, which fits well with stock market gains.
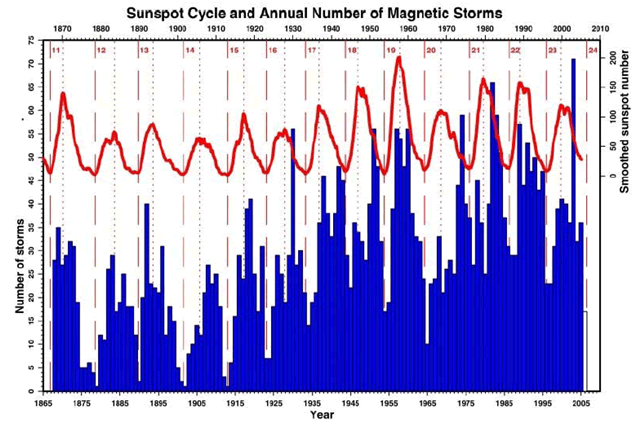
Source: Susan Macmillan, British Geological Survey
Solar Cycle 24 began around December 2008 with a solar minimum and it is predicted to peak in July 2013. An average gain of 70% for the Dow over this period would translate as 14500 by mid 2013 (which would mean a new nominal all time high).
A recession has closely followed solar peaks for each solar cycle in the last 100 years. The average recession duration is 1 year. The average length of recession-induced stocks bear markets is 1 year 4 months. As the stock market is forward looking, and a leading indicator, we could therefore find the the stock market peaks around the beginning of 2013 and then declines into the solar peak in mid 2013, and then declines through a recession into 2014.
Dow-Commodities ratios and consumer price inflation should peak at extremes at the solar peak (as has occurred each time in the last century), suggesting commodities should push on all the way into mid-2013 whilst stocks lag in the last few months. This final divergence occurred in previous secular inversions in history. If the Dow were at 14500 at this relative peak point, then historical Dow-commodity ratio extreme inversion points can be our guide as to where gold and oil should then be.
The Dow-gold ratio has thus far made a low of 6.86 in this secular bull/bear, so a greater extreme than this needs to be reached. However, based on the 200 year Dow-Gold ratio chart anything beneath this level may qualify as a turning point, but note that levels of 1-2 were hit in the last 2 secular instances.
If Dow-gold bottoms at 6 and Dow is 14500: gold is $2400.
If Dow-gold bottoms at 1 and Dow is 14500: gold is $14500.
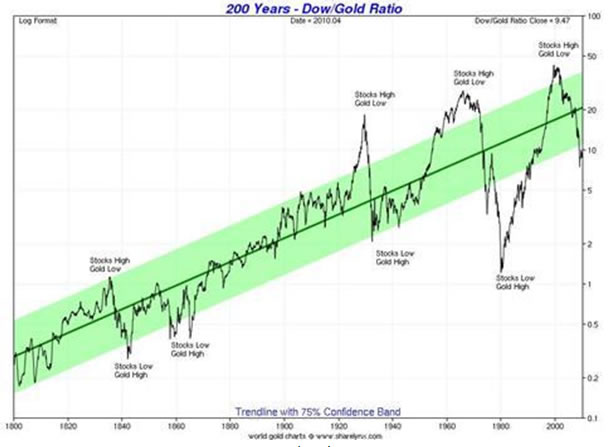
Source: Sharelynx.com
The Dow-oil ratio, based on historic extreme turning points, could bottom at 75 or below.
If Dow-oil bottoms at 75 and Dow is 14500: oil is $200.
If Dow-oil bottoms at 50 and Dow is 14500: oil is $300.
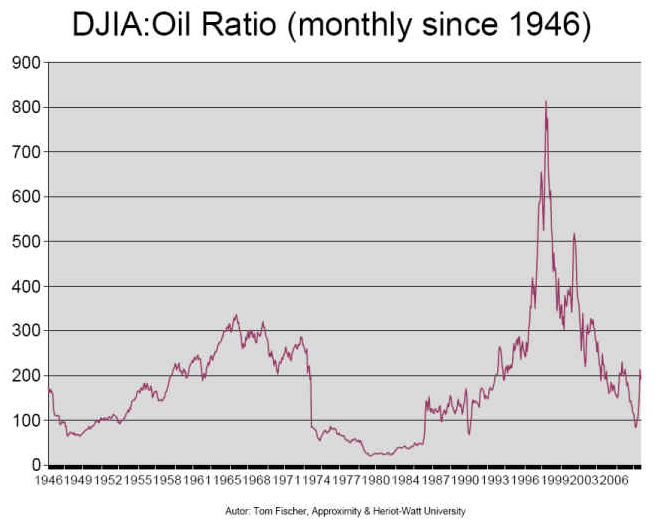
Source: Approximity
Understand that Dow 14500 is calculated on AVERAGE historic gains only so should not be given too much emphasis. However, my recent pieces of analysis on the cyclical stocks bull suggest such a 17% gain from current levels to be more pessimistic than optimistic, as a market top. Previously I have reasoned for minimum targets of $2000 gold and $150 oil. The above calclulations therefore suggest we should not be suprised to reach some way higher.
--------------------------------------------------------------------------------
In summary, there is a correlation between stock market performance and solar cycles. A profitable strategy over the last century would have been to buy at the solar minimum and sell at the next solar maximum, and repeat for an average 70% gain in each instance.
An even more profitable strategy would have been to buy and hold over 2-3 decades in between 3 specific half solar cycles. This strategy would have produced 10-fold gains each time, and pattern continuation suggests such a repetition from the solar minimum at the end of 2008 looking out to the 2030s, in line with a further secular stocks bull.
Looking shorter term to the solar peak around mid-2013, stocks should track yet higher, and this implies commodities much higher, as an extreme relative pricing of commodities over stocks should be reached around that solar peak, before a secular inversion.
John Hampson
John Hampson, UK / Self-taught full-time trading at the global macro level / Future Studies
www.amalgamator.co.uk / Forecasting By Amalgamation / Site launch 1st Feb 2011
© 2011 Copyright John Hampson - All Rights Reserved
Disclaimer: The above is a matter of opinion provided for general information purposes only and is not intended as investment advice. Information and analysis above are derived from sources and utilising methods believed to be reliable, but we cannot accept responsibility for any losses you may incur as a result of this analysis. Individuals should consult with their personal financial advisors.
© 2005-2022 http://www.MarketOracle.co.uk - The Market Oracle is a FREE Daily Financial Markets Analysis & Forecasting online publication.