


Commodities Crash Pain Eased by Dividends From Large-Cap Stocks
Stock-Markets / Financial Markets 2011 May 09, 2011 - 06:39 AM GMTBy: Money_Morning

 Jon D. Markman writes:
After several weeks of quiet in the markets, economy and geopolitics, last week exploded with excitement and volatility, seeing commodities tumble and large-cap stocks end strong.
Jon D. Markman writes:
After several weeks of quiet in the markets, economy and geopolitics, last week exploded with excitement and volatility, seeing commodities tumble and large-cap stocks end strong.
It started with news that Seal Team Six had taken out Osama bin Laden in Pakistan and ended with silver crashing 26%, crude oil plunging 15%, and corn down 6.5%. Determining how these events are connected will provide historians with rich material to ponder in years to come.
It is very rare to see the prices of unrelated commodities plummet like that in a single week. It's an event that might occur once in a generation. Now you can say you were there.
When you consider that these commodities are all inputs for industrial manufacturers, you would intuitively imagine that stock prices would jump on the news. Suddenly the prices of two major expenses -- raw materials and fuel -- are lower. But that's not how it worked out.
Large U.S. companies' shares fell by 1.5% over the week, while small companies' shares sank 3.6%. Overseas markets fell 3.5%.
The big news of the week was in the commodity pits, where crude oil futures plunged under $100 a barrel for the first time since February. On Thursday alone, gasoline futures plummeted 7%, heating oil fell 8% and natural gas fell 7.9%. Over in the metals, gold sank 2.7%, silver sank a whopping 12% and even palladium sank 4.5%.
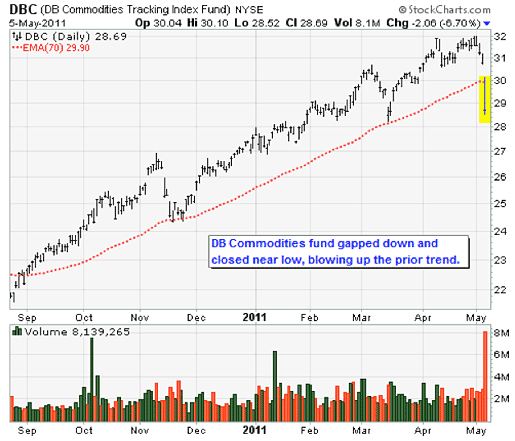
The grains and softs were in no better shape. Corn fell 2.8% despite a difficult start to the growing season in the rain-soaked southeast, while oats fell 3.6%, rough rice fell 5.6% and cotton fell 3.3%. All commodities are represented in the PowerShares DB Commodities Index Tracking Fund (NYSE: DBC) chart, above, which broke down in a big way.
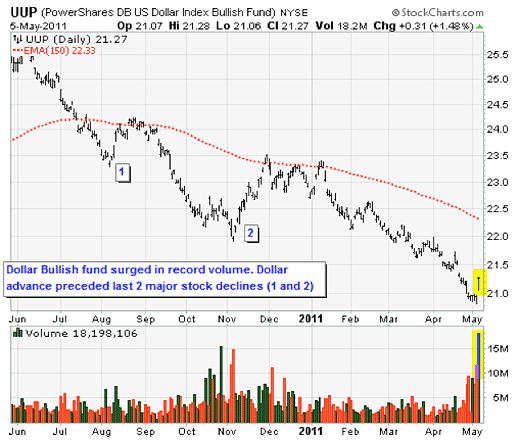
The main issue that traders were dealing with Thursday, and really the spark that puts the whole engine in motion, was the sharp advance in the value of the dollar. As you can see in the accompanying chart, the U.S. dollar gapped up Thursday in a way very reminiscent of the last two times that it shot back to its declining 150-day average.
I've read a lot of explanations as to why the dollar rose, but it was probably stirred by the European Central Bank's surprise decision not to raise interest rates.
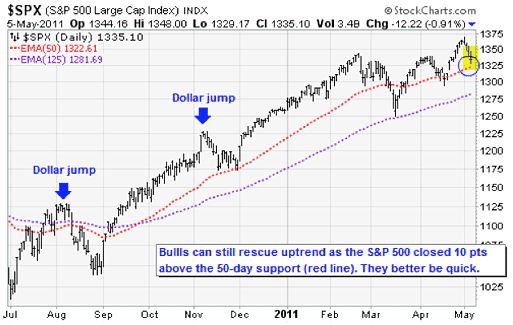
The last two times the dollar jumped like this led to a prolonged commodities price decline and more important for us, a multi-week decline in stock prices. Surely you remember the tough month of August last year, as well as the difficulties of last November. They both started with a dollar spike higher that looked very similar to Thursday. For reference, check out the chart below.
Large-Cap Stocks: Strength in Numbers
Showing resilience during a tough week was a group of stocks that has not been heard from much in the past two years. A group that has been standing on the sidelines of the big dance, waiting for someone cute to tap them on the shoulders and pull them in.
I'm talking about large-cap stocks, like the dividend-paying defensive stocks in the telecom, drug and utility sectors, such as AT&T Inc. (NYSE: T), Eli Lilly & Co. (NYSE: LLY), Exelon Corp. (NYSE: EXC) and the enigmatic, suddenly awesome Intel Corp. (Nasdaq: INTC), which is almost hard to categorize these days. The chipmaker is acting as if it is high on Red Bull and pixie dust -- the surprise leader of a fairly moribund technology sector.
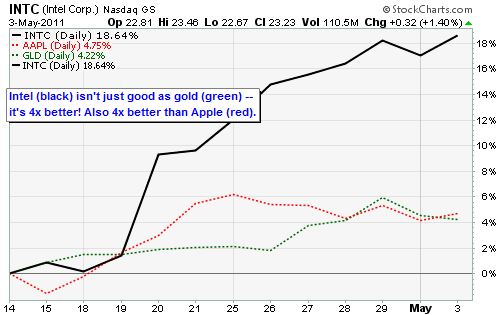
Everyone who thought Intel would be up four times more than Apple Inc. (Nasdaq: AAPL) three weeks after each reported Q1 earnings, as shown above, raise your hands. I don't see too many. Not sure what this means, but look back a few days to find my 12-year chart of Intel and you will see it is lifting out of an excruciating downtrend now and has a legit shot at $30 if the animal spirits continue to stir.
That was the 2002 high, though of course it would have to triple from here to get back to its 2000 high. The $30 level is very possible, as Intel is one of the very few survivors of the 1990s tech bubble that has not at least kissed its 2001 level for a minute in the past five years.
Even Microsoft Corp. (Nasdaq: MSFT), a bag of bones and old code, has done that, in 2008. Dell Inc. (Nasdaq: DELL), a lonesome dove, did it in 2005. Oracle Corp. (Nasdaq: ORCL) did it in 2010 and has not stopped since, and is now pressing on 2000 levels. So keep an eye on Intel. Its forward Price/Earnings multiple is a meager 9.6 despite a year-over-year earnings growth rate of 39%, and a robust return on equity of 25%. It's so cheap it makes your eyes water.
Indeed, this is a great example of a company that could double merely from an increase of confidence that took its P/E up to the low to mid-teens like, um, Kimberly-Clark Corp. (NYSE: KMB)and Colgate-Palmolive Co. (NYSE: CL), which are not exactly growth powerhouses. Keep in mind that one of its chief antagonists, the mobile chip giant ARM Holdings Plc (Nasdaq ADR: ARMH), rocks a P/E of 90, as befits a king.
What kind of world do we live in where the world's biggest chipmaker is less highly valued than tissue and soap makers? The recent price move is signaling the start of a change of opinion, and the mood does not have to change very much for shares to lift. I don't own it, and it is not in any of my models, but I find the story intriguing and worth investigating further.
Divvy It Up
One fascinating thing about the Tuesday session in particular last week was that if you look at the stocks in theDow JonesIndustrials that pay a dividend yield of 3% or greater, you will see that all but one was up, and some performed very well -- much better than you would expect given the fact that the index finished flat. Here they are, with the Tuesday change in the last column.
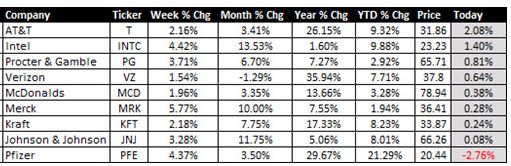
The two stocks that pay the lowest dividend in the DJIA -- Bank of America Corp. (NYSE: BAC) at 0.3%, and Alcoa Inc. (NYSE: AA), at 0.6% -- were actually up a little more than 2% each as well, suggesting that they are seen as good values despite their low yield.
The point of these observations is that if you were in this elite set of high-divvy stocks -- mostly non-speculative, conservative names -- then you didn't even notice the volatility that wracked the rest of the market. Most of the strong negative, churning action in the market occurred in the commodity-related stocks that have become a bit more speculative due to a nascent reversal in the dollar to the upside.
This could be a change of tone in the market, though two days' action is not enough time to say for sure. But if we just look at the one-year returns of most of these conservative dividend payers, we can see that they at least have been buoyant for most of the recent past.
The upshot is that the DJIA has quietly become the leading index of the past month among institutional investors -- better than the Nasdaq, better than the Standard & Poor's 500 Index. I think it is most likely part of this move we have been discussing toward a refocusing by institutional investors on big, strong, reliable, high-earning, high-yielding thoroughbreds in the next phase of the cycle.
Over the course of the whole year, the evidence still suggests that mid-cap growth will be the winner of the size/style sweepstakes. But the homeboys of the Dow could make it a race. We'll look for a good location to buy them. Maybe it really will be that simple this year. Could happen.
The plain-wrap version is in the fund SPDR Dow Jones Industrial Average ETF (NYSE: DIA), and there are also two leveraged versions, the 2x ProShares Ultra Dow30 ETF(NYSE: DDM) and the 3x ProShares UltraPro Dow30 ETF (NYSE: UDOW).
The Volatility Factor
As for volatility, it's been in an epic downtrend for the past 24 months, as the CBOE Volatility Index has sunk to around 15 from 80. As you can see in the chart below, the index, sometimes called the Fear Gauge, dropped to a four-year low last week.
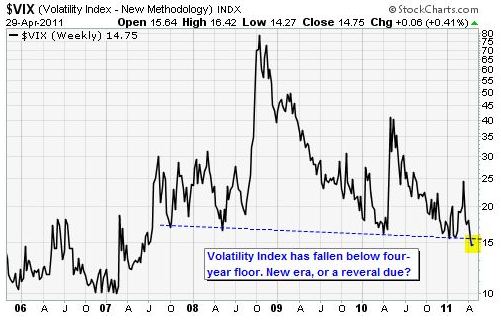
I'm sure that most investors would be perfectly happy if volatility continued to trend even lower. And with inflation low and liquidity abundant, there is no reason why it could not ultimately get back to the 10 level, which prevailed during much of 2005-2007, by this time next year.
That would constitute a big surprise for bears who expect the market to crash under the weight of debts, lifting volatility skyward again.
In the near term though -- i.e. the next couple of months -- my research does suggest that a combination of factors, including the end of the Fed's bond-buying program, the rise of energy inflation, and austerity politics in Congress, could create a lot more jumpiness.
This would actually give us the best of both worlds: We like volatility because it shakes loose windows of opportunity. Any major setbacks such as what we saw in March would give us a chance to buy our favorite long-term ideas -- energy, industrials, healthcare, emerging Asia and possibly Europe -- at lower prices. Stay tuned.
The Week Ahead
May 9: Nothing scheduled
May 10: Import prices.
May 11: International trade gap, U.S. Treasury monthly budget report.
May 12: Producer price index, retail sales, initial jobless claims.
May 13: Consumer price index; Consumer sentiment.
[Editor's Note: Money Morning Contributing Writer Jon D. Markman has a unique view of both the world economy and the global financial markets. With uncertainty the watchword and volatility the norm in today's markets, low-risk/high-profit investments will be tougher than ever to find.
It will take a seasoned guide to uncover those opportunities.
Markman is that guide.
In the face of what's been the toughest market for investors since the Great Depression, it's time to sweep away the uncertainty and eradicate the worry. That's why investors subscribe to Markman's Strategic Advantage newsletter every week: He can see opportunity when other investors are blinded by worry.
Subscribe to Strategic Advantage and hire Markman to be your guide. For more information, please click here.]
Source : http://moneymorning.com/2011/05/09/...
Money Morning/The Money Map Report
©2011 Monument Street Publishing. All Rights Reserved. Protected by copyright laws of the United States and international treaties. Any reproduction, copying, or redistribution (electronic or otherwise, including on the world wide web), of content from this website, in whole or in part, is strictly prohibited without the express written permission of Monument Street Publishing. 105 West Monument Street, Baltimore MD 21201, Email: customerservice@moneymorning.com
Disclaimer: Nothing published by Money Morning should be considered personalized investment advice. Although our employees may answer your general customer service questions, they are not licensed under securities laws to address your particular investment situation. No communication by our employees to you should be deemed as personalized investent advice. We expressly forbid our writers from having a financial interest in any security recommended to our readers. All of our employees and agents must wait 24 hours after on-line publication, or 72 hours after the mailing of printed-only publication prior to following an initial recommendation. Any investments recommended by Money Morning should be made only after consulting with your investment advisor and only after reviewing the prospectus or financial statements of the company.
Money Morning Archive |
© 2005-2022 http://www.MarketOracle.co.uk - The Market Oracle is a FREE Daily Financial Markets Analysis & Forecasting online publication.