


Gold and Commodities 2011 Halftime Report
Commodities / Commodities Trading Jul 19, 2011 - 07:53 AM GMTBy: Frank_Holmes

 Commodities don’t all perform in the same way. In any given year, a particular commodity will go gangbusters and outperform the group. However, that commodity will typically come back to Earth and underperform the following year or the year after that. This is why active management is important when investing in commodities. Active managers can benefit from rotating from winners to laggards or by investing in the companies which produce, farm or mine commodities most effectively.
After two straight years of tremendous gains for many commodities, the first six months of 2011 haven’t been as kind. As of the end of June, only two commodities (silver and coal) saw double-digit increases, and only six of the 14 commodities we track—less than half—were in positive territory.
Silver was the leader, rising more than 12 percent, followed closely by coal (up 11.95 percent). Other commodities increasing in value included gold (5.6 percent), crude oil (3.83 percent), lead (2.16 percent) and aluminum (1.73 percent).
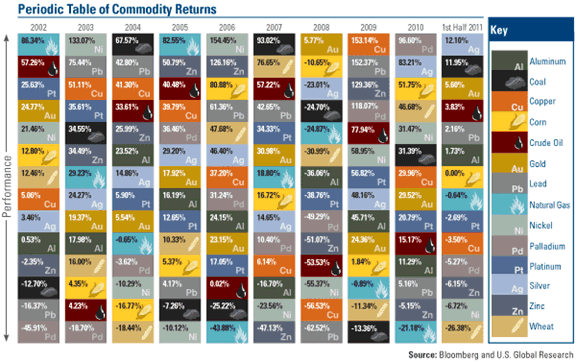
Returns are based on historical spot prices or futures prices. Past performance is no guarantee of future results.
Silver
Silver prices got ahead of themselves earlier this year, climbing 58 percent to nearly $50 an ounce. This registered a four standard deviation move, representing extreme territory on our models. Thinking silver, which has historically been a narrowly-traded market, had become a potential haven for speculators, officials stepped in and raised margin requirements on the Comex. This quickly deflated the bubble and prices naturally reverted back toward the mean but remain well above where they began the year.
Coal
Strong demand from reconstruction projects in Japan along with reduced supply because of flooding in Australia, Indonesia, South Africa and Colombia led coal to be the second-best performer.
No country was more affected by the lower supply than China as coal powers the Chinese economy. The country is the world’s largest consumer, gobbling half of the world’s coal. Coal accounted for 71 percent of China’s energy in 2008—more than three times the United States’ share. The Electricity Council estimates that China’s coal demand will reach 1.92 billion tons in 2011, up nearly 10 percent from 2010. Chinese electricity use was up 13.4 percent on a year-over-year basis in May and is now expected to rise 12 percent this year. (Read: Coal Use in China Shines Light on Growth)
Gold
Gold prices passed $1,500 for the first time ever in mid-April of this year and ended the quarter just slightly below that mark as a mixture of the Fear Trade and Love Trade proved to be an enticing concoction for investors here and abroad. The World Gold Council reported that demand for gold as an investment was up 26 percent on a year-over-year basis during the first quarter. In China, demand for gold was so strong it outpaced the combined gold demand of the U.S., France, Germany, Italy, Switzerland, the U.K. and other European countries. (Read: Asian Tiger Sinks Teeth Into Gold)
Although gold prices held steady during the first half of the year, the share prices of gold companies have lagged. Ralph Aldis and I discussed this hot topic in depth a few weeks ago. (Read: Will Gold Equity Investors Strike Gold?) Many gold companies’ corporate cash flows and earnings per share have been rising, and more companies are paying dividends. Gold stocks also appear cheap compared to the price of gold. We believe investors will be drawn to these qualities, lifting gold stocks along with the strong bullion price.
Oil
After two straight years of solid gains, oil prices finally surpassed the $100 per barrel mark once again early in 2011. This time, it was a dose of geopolitical risk and a natural disaster that sent oil prices shooting upward. Oil prices have since bounced around the $90-$100 range for West Texas Intermediate (WTI). That range has held up despite U.S. consumers cringing at gasoline prices, the International Energy Agency (IEA) releasing an additional 60 million barrels of oil to the market and China’s ardent attempts to cool its economic growth. (Read: Playing Cat and Mouse with Global Oil)
Despite tightening measures, China’s per capita oil consumption has retained its upward trajectory and is headed toward levels similar to Taiwan and South Korea. There’s still quite a gap to close before that happens, but China’s oil consumption per capita has increased over 350 percent since the early 1980s to an estimated 2.7 billion barrels per year in 2011. Nearly 100 percent of that has taken place in the past decade. In addition, oil consumption per capita has risen sharply in recent decades in other Asian countries such as Malaysia (nearly quadrupled) and Thailand (doubled).
Looking Forward to the Second Half of 2011
We think commodity price movements will fare better during the second half of the year. Goldman Sachs wrote in a report last week that it expects global economic growth to be “generally supportive of rising commodity demand” and “this demand growth will be sufficient to tighten key commodity markets over the next six to 12 months.” We believe gold, oil and copper are some of the commodities which could see the biggest gains. For the sake of brevity, we’ll highlight gold here today. Check out my “Frank Talk” blog Tuesday and Wednesday for our previews on oil and copper. (www.usfunds.com/franktalk)
Gold
As BCA Research puts it, “[gold] prices have benefited from a ‘perfect storm’ in recent months: falling real interest rates, a weak dollar, fears of a U.S. recession and/or debt default, and European stress.” Those factors, which I affectionately refer to as the Fear Trade, are what sent gold prices flirting with the $1,600 an ounce level this week. There was also the release of Federal Reserve meeting minutes that showed QE3 is possible, though not yet probable given Chairman Bernanke’s testimony last week. By the way, if you haven’t already seen Bernanke’s exchange with Congressman Ron Paul on gold, go to YouTube and check it out for a good chuckle. Washington’s reluctance to present a solution to the debt ceiling issue also contributed heavily to gold’s performance.
Paul was bringing attention to the threat of currency debasement, a major reason investors all over the world are turning to gold. According to U.K. research firm Capital Daily, the U.S. monetary base has increased more than 200 percent since September 2008. Meanwhile, gold prices have risen only about 70 percent over the same time period. Capital Daily says “if the two had been directly related, gold should already have risen to around $2,800 [an ounce].” That’s obviously a lofty expectation but illustrates that gold prices haven’t appreciated nearly as much as currencies, such as the U.S. dollar, have been debased.
In fact, don’t believe what you read about record high gold prices. Yes, gold hit a high in nominal terms, but the price is more than 30 percent below the 1980 peak of $2,400 an ounce if you adjust for inflation.
This was a banner week for the Fear Trade but don’t count out the Love Trade. Gold is about to get even more attractive because we are heading into the fall and winter gift-giving season. This is the time of year when gold jewelers typically do their biggest business. The kickoff is the Muslim holy month of Ramadan, which starts next month and ends with generous gift-giving in early September.
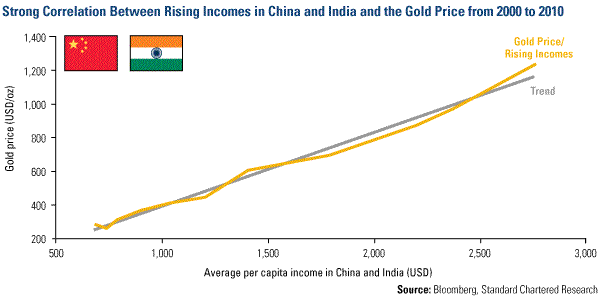
The key to this seasonal strength over the past few years has been demand from China and India. You can see from the chart that the rise in gold prices has been closely tied to the rise in gold demand from China and India. Back when the average per capita income in China and India was well below $1,000 a year, gold prices hovered just above $200 an ounce. As average incomes have approached $3,000 a year over the past decade, gold prices have followed. With the long-term outlook for wages in both these economies rather rosy, gold demand should continue to feel the trickle-down effect.
Those investors looking for more of a technical indicator can take a look at the ratio of gold and oil. Capital Daily says that the ratio of the price for one ounce of gold to one barrel of oil (Brent crude) is currently 13.5. Since 1970, the average has been around 16. Gold prices would need to rise to $1,870 an ounce in order to reach historical ratio levels with $117 per barrel Brent crude oil, according to Capital Daily.
Based on seasonal demand strength and sovereign debt fears of the U.S. and several European countries, we think gold prices could be headed higher.
Tune in to “Frank Talk” on Tuesday and Wednesday for second half 2011 previews of oil and copper.
U.S Global’s global market insights are now available “on the go” with mobile applications for the iPhone, Blackberry and iPad. Download the free apps today and access a whole new world of investing with the swipe of your finger. Download the apps.
By Frank Holmes
CEO and Chief Investment Officer
U.S. Global Investors
U.S. Global Investors, Inc. is an investment management firm specializing in gold, natural resources, emerging markets and global infrastructure opportunities around the world. The company, headquartered in San Antonio, Texas, manages 13 no-load mutual funds in the U.S. Global Investors fund family, as well as funds for international clients.
All opinions expressed and data provided are subject to change without notice. Some of these opinions may not be appropriate to every investor.
Standard deviation is a measure of the dispersion of a set of data from its mean. The more spread apart the data, the higher the deviation. Standard deviation is also known as historical volatility. All opinions expressed and data provided are subject to change without notice. Some of these opinions may not be appropriate to every investor. The S&P 500 Stock Index is a widely recognized capitalization-weighted index of 500 common stock prices in U.S. companies. The NYSE Arca Gold BUGS (Basket of Unhedged Gold Stocks) Index (HUI) is a modified equal dollar weighted index of companies involved in gold mining. The HUI Index was designed to provide significant exposure to near term movements in gold prices by including companies that do not hedge their gold production beyond 1.5 years. The MSCI Emerging Markets Index is a free float-adjusted market capitalization index that is designed to measure equity market performance in the global emerging markets. The U.S. Trade Weighted Dollar Index provides a general indication of the international value of the U.S. dollar.
Frank Holmes Archive |
© 2005-2022 http://www.MarketOracle.co.uk - The Market Oracle is a FREE Daily Financial Markets Analysis & Forecasting online publication.