


Does Gold’s Correlation with Stocks Mean that it’s No Longer a Safe Haven?
Commodities / Gold and Silver 2011 Dec 05, 2011 - 02:16 AM GMTBy: Bob_Kirtley

 In this article we examine the current and past relationship between gold and the S&P 500 index and whether or not gold still remains a “safe haven”. In the past gold has often had a low positive relationship with the S&P, with that relationship trending negative in times of economic turbulence (hence gold’s safe haven status) but that trend has not held over the past 10 weeks. We aim to answer the implications this has for gold in the future.
The stock market (by definition) slows and offers low or negative returns in times of economic strife. The modern day response from central banks is to pump (print) money into the economy in a bid to fuel growth or as is the current situation - delay the significant part of the hangover.
The extremely loose monetary policy which central banks world over are adopting is keeping interest rates low. Real interest rates are currently extremely low or negative (which is observed in the US TIPS market) and this is extremely bullish for gold. For new readers, we have covered these dynamics in past articles.
In the current circumstances, some policy actions are bullish for both gold and the stock market. The U.S. economy is faltering and there are no signs of improvement. The Fed’s response is to operate incredibly loose monetary policy to stimulate growth and reduce unemployment. Monetary easing raises the value of gold through devaluation in the USD amongst other reasons.
The desired outcome of loose monetary policy is a boost for the economy as a whole. The equities market is the timeliest and one of the more accurate gauges for the state of the economy. Lower interest rates and an increased money supply (monetary easing) boost the stock market – an elementary economic concept.
What we can deduce is that monetary easing is bullish for gold and the S&P 500. In times of economic strife, the two are likely to be more highly correlated.
As a result, if the market is focused on whether the Federal Reserve or ECB will ease monetary policy, then gold and the S&P will likely follow each other. This is the situation we currently find ourselves in, especially with the immense uncertainty surrounding the Eurozone.
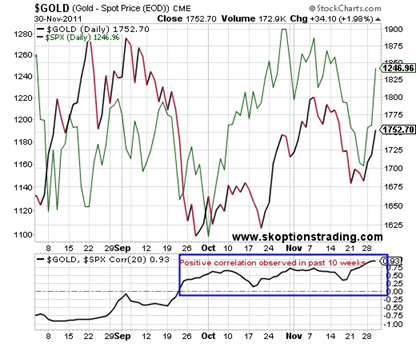
Some are calling the end of gold as the traditional safe haven asset in times of turbulence in the equities market. When they say this, they mean gold and the S&P 500 are now much more (and predominantly) positively correlated than in the past. Whilst some think this is a cause for concern for all those using gold as a safe haven hedge, we disagree.
This conclusion is extremely premature. Periods of positive correlation with the S&P are far from unprecedented as shown below.
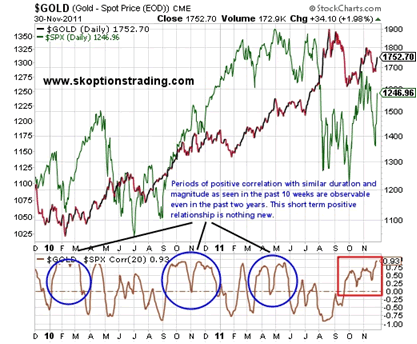
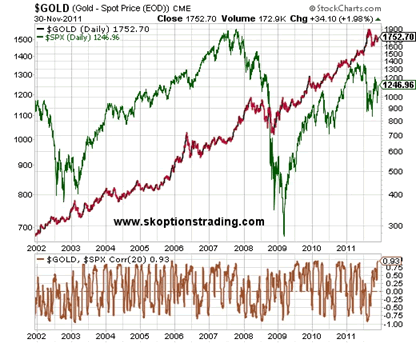
The 10 year chart below shows how much the relationship between the S&P and gold ebbs and flows (variability in bottom pane).
Some events such as quantitative easing and a weak USD drive both stocks and gold higher, therefore the two will be correlated at times. Fundamentally the two assets remain vastly different and more often than not will move in opposing directions.
Referring back to graph 2 in this article one can see the dramatic decline of stocks and rise of gold in late July/early August 2011. The point we are trying to make is that there is no hard and fast rule dictating the relationship between gold and the U.S. stock market. The relationship is as dynamic as the market itself.
The correlation between gold and the S&P in a 12 month period over the last eight years is as follows:
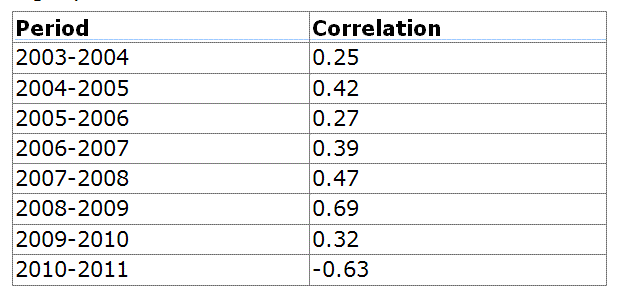
What is very interesting to note is that out of the last eight years, gold has exhibited the only negative, and second strongest overall relationship with the S&P 500 over the last 12 months. This reinforces the view that gold is most definitely a safe haven asset, now more than ever.
Note: The positive relationship observed in the last 10 weeks is insignificant, relative to the overwhelmingly negative relationship over the majority of the last 12 months. This is why the annual correlation statistic still shows such a strong negative relationship, in spite of the positive trend over the last 10 weeks.
We see tremendous upside in gold. The global economy is very poor, there is no argument to the contrary. We see two possible actions by central banks in response to the current situation. One response is to do very little – let the invisible hand deal with the mess and hopefully all sorts itself out eventually. The other is further intervention which may or may not help the situation, depending on what form the intervention takes. Inaction will result in further deterioration in the global economy, and consequently gold rises due to safe haven demand. Further intervention/easing is also bullish for gold as explained in previous articles.
Stocks and gold are not the only assets that rise during periods of easing.
The graph below shows the run up to, and start of QE2 on November 12th 2010. Plotted are gold, copper, light crude and the S&P 500. The relationship is remarkable. All these assets followed each others movements very closely.
Although all these assets are unique and have vastly different fundamentals, under certain conditions, they trade in the same manner. Many factors determine the price of gold, stocks and all other assets. However under certain circumstances, as we have seen, they can and will move in the same direction.
The conclusion is that although assets may have very different fundamentals, under certain conditions they can trade in the same direction.
One of the factors that all assets, whether they be bonds, stocks, gold, oil or what have you have in common is their sensitivity to monetary policy and because an easing in monetary policy is bullish for all these aforementioned assets, they can all trade together when the market is focused on easing. When attention is not on the direction of monetary policy, the correlation between commodities/gold/stocks breaks down and the traditional fundamentals return as the major determinants of their respective prices.
As already mentioned, gold and stocks exhibited a positive relationship during QE2. Both assets rose, but for different reasons. Equities rose due to the anticipated improvement in economic conditions. Employment and consumer spending were expected to rise, as a result companies were likely to see a rise in future profits and hence their current value increased.
Gold rose during QE2 as more US dollars were printed, the less those USD were worth, and the more gold (essentially another currency) was worth relative to the value of the USD.
Had economic conditions improved for some other reason, such as higher than expected employment statistics from organic growth in the economy, the stock market still would risen and gold likely would not have. What we can infer is that monetary easing is one of the infrequent circumstances that gives rise to gold and the S&P tracking positively.
Statistics 101 – Correlation does not imply causation. Even though there has been, and will continue to be, periods where gold and the stock market are positively correlated, the fundamental analysis points towards gold still being the safe haven hedge it has always been.
We continue to believe that the current market environment is supportive of higher gold prices. We trade gold using options on GLD, which can be traded as easily as any other stock option. Using options allows us to tailor our position to match our view, enabling us to place trades that are not simply speculating that gold will go up or down. To find out how options could add more versatility to your trading portfolio please visit www.skoptionstrading.com. Our subscribers receive regular market updates, detailed trading signals and a model portfolio with specific suggested capital allocations to each trading recommendation. Our full trading record can be viewed on our website.
To stay updated on our market commentary, which gold stocks we are buying and why, please subscribe to The Gold Prices Newsletter, completely FREE of charge. Simply click here and enter your email address. (Winners of the GoldDrivers Stock Picking Competition 2007)
For those readers who are also interested in the silver bull market that is currently unfolding, you may want to subscribe to our Free Silver Prices Newsletter.
DISCLAIMER : Gold Prices makes no guarantee or warranty on the accuracy or completeness of the data provided on this site. Nothing contained herein is intended or shall be deemed to be investment advice, implied or otherwise. This website represents our views and nothing more than that. Always consult your registered advisor to assist you with your investments. We accept no liability for any loss arising from the use of the data contained on this website. We may or may not hold a position in these securities at any given time and reserve the right to buy and sell as we think fit. Bob Kirtley Archive |
© 2005-2022 http://www.MarketOracle.co.uk - The Market Oracle is a FREE Daily Financial Markets Analysis & Forecasting online publication.