


The Return of Stock Market Volatility
Stock-Markets / Stock Markets 2012 Feb 12, 2012 - 07:32 PM GMTBy: Clif_Droke

 To say that complacency has reigned in the last few months is an understatement. Volatility as measured by the CBOE Volatility Index (VIX) has fallen 60% since October and 20% since the start of 2012.
To put into context just how much volatility has fallen since the latest rally kicked off in October, the 10-year chart of the S&P 100 Volatility Index (VXO) is shown below. The VXO is an excellent frame of reference for the absence of widespread fear in this market in recent months. As you can see, volatility is approaching historically low levels not seen since before the credit crisis began.
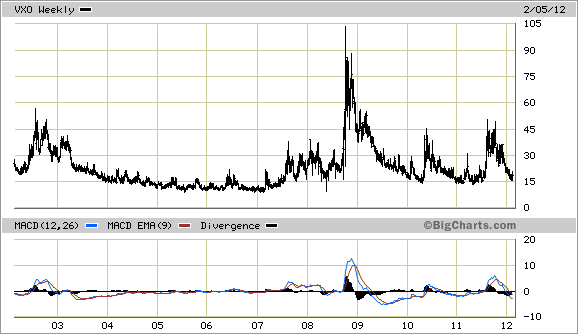
Options traders often use readings in the VIX and VXO to gauge whether investors have become overly complacent. It has been noted that when volatility subsides to historically low levels like we're now seeing, it tends to generate its own reversal (based on the contrarian principal that the crowd can't be on the right side of the market's trend for long).
But the old saw that retail investors "can't be right for too long" can sometimes be misleading. Check out the years 2004, 2005 and 2006 in the above chart and you'll see what I mean. These were low volatility years by historical standards and the market remained in strong hands for the most part during this 3-year period. The reason for this sustained period of low volatility can be attributed to the position of the longer-term yearly cycles during 2004-2006. The 6-year, 10-year 12-year cycles were either up or peaking during much of this time period. This doesn't even take into account the influence of monetary policy and bank credit factors which were then in effect.
On a shorter-term basis, volatility is largely influenced by the weekly Kress cycles, or more specifically, by the interaction between the peaking and bottoming cycles. Cyclical cross currents create market volatility and this volatility is reflected by an increase in the VIX. VIX has been abnormally low in recent weeks, which has coincided with an increasing level of investor complacency. Again, we aren't justified in assuming that because complacency is high and volatility is low that the intermediate-term uptrend for stocks is doomed. Rather, we must look for answers from the weekly cycles.
The nearest weekly Kress cycle of intermediate-term consequence is scheduled to peak next Friday, Feb. 17 (plus or minus). A second interim weekly cycle will peak around March 9. There is a greater than average chance that one of these two cycles could put a significant peak on the market, though we won't know for sure which of the two dates is most likely to be the interim high until closer to the cycle peaks.
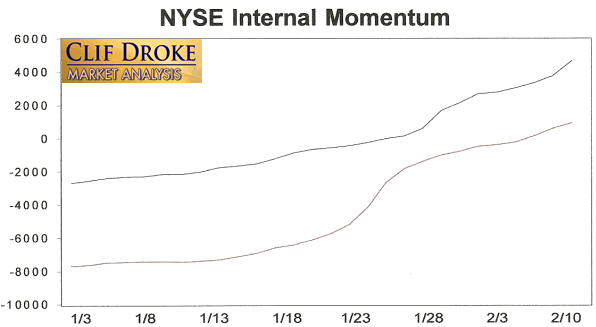
The question we need to examine is whether the upcoming cycle peak next week will put the interim peak on the market. While we must be prepared for this possibility, I don't believe the next few days will witness anything beyond a short-term market peak, which in turn would offer the market a much-needed breather after its run-up of the last several weeks. There is still a strong current of internal momentum behind this market which argues against a major interim top happening right now.
The following chart shows the extent of this strong intermediate-term momentum. The blue line is the sub-dominant interim momentum for the NYSE stock market while the red line is the dominant interim momentum. Both are still rising at a solid rate of change and should act as a support against any attempt by the bears to raid this market in the coming days while the first of the two weekly cycles peak.
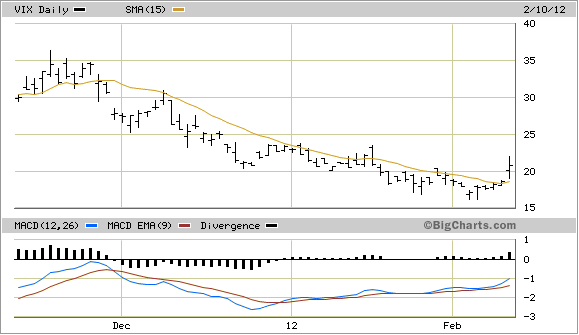
Although the broad market still enjoys a strong measure of underlying support from this internal momentum, volatility looks to be on the rise in the coming weeks. The CBOE Volatility Index (VIX) broke out decisively above its 15-day moving average for the first time since November as you can see here.
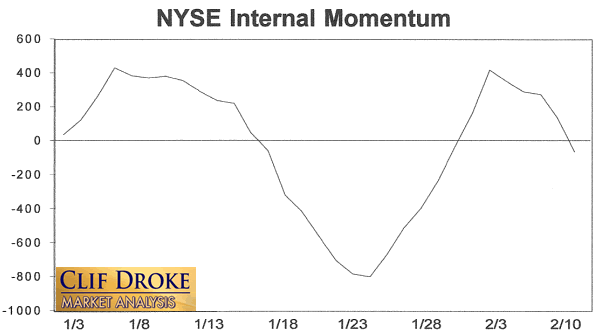
Most of the internal momentum indicators which comprise the HILMO index are still in an upward trend. One indicator that is diverging from the rest is the dominant longer-term momentum indicator (below), which is the longest of the internal momentum indicators in the HILMO index. The indicator has made a series of lower highs as you can see here and has just re-entered negative territory as of Friday, Feb. 10.
The interplay between the declining longer-term momentum and the rising intermediate-term momentum discussed previously is likely to create some volatility in the weeks ahead. Volatility was extremely low in recent weeks, mainly because NYSE internal momentum was synchronized to the upside. Now that this is no longer the case, the friction created by these internal cross-currents typically brings about increased volatility, which is normal around a weekly cycle peak. Thus we can probably expect to see more an increasing amount of volatility from here, especially after the March cycle peak.
As an accompaniment to the loss of cyclical support within the next few weeks, we should also expect to see a return of Wall Street's fixation on the eurozone debt drama. Investors have gotten a reprieve from the constant bombardment of negative headline over the Greek and Italian debt crises. That's typical of a market environment were the weekly cycles are synchronized to the upside - in such periods as we've experienced the last few weeks, good news tends to dominate the headlines and bad news is put on the backburner.
With the return of cycle-induced volatility we can expect to see the financial press fixating on bad news once again. And the media won't have to search far in order to find something negative to fixate on: the "Greece trap" is the most obvious choice.
Gold ETF
After confirming an immediate-term buy signal just three days into the New Year, the SPDR Gold Trust ETF (GLD) has closed below its dominant immediate-term 15-day moving average for the first time this year. GLD advanced 8% from its initial buy signal in early January to its recent peak on Feb. 2. On balance, an 8% rally from an immediate-term buy signal is typical, especially when internal momentum is rising (as it was until late January).
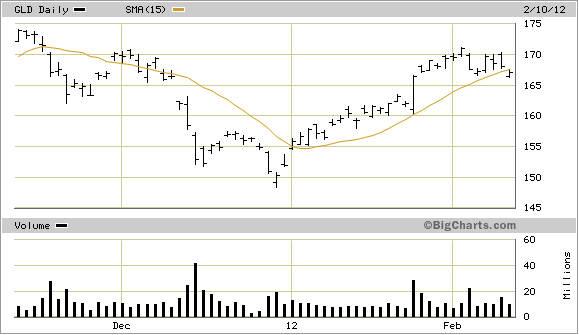
The latest close under the 15-day MA technically qualifies as an immediate-term sell signal for GLD, though there's still a chance this signal will soon be reversed. How gold reacts to the upcoming Greek bailout vote will set the tone for the weeks ahead.
Cycles
Over the years I've been asked by many readers what I consider to be the best books on stock market cycles that I can recommend. While there are many excellent works out there on the subject of technical and fundamental analysis, chart reading, etc., precious few have addressed the subject of market cycles. Of the relatively few books on cycles that are available, most don't even merit mentioning. I've read only one book in the genre that I can recommend - The K Wave by David Knox Barker - but even that one doesn't deal directly with stock market cycles but instead with the economic long wave. I'm pleased to announce, however, that after nearly 10 years of research and one year of writing, I've completed a book on the subject that I believe will meet the critical demands of most cycle students. It's entitled, The Stock Market Cycles, and is available for sale at: http://clifdroke.com/books/Stock_Market.html
By Clif Droke
www.clifdroke.com
Clif Droke is the editor of the daily Gold & Silver Stock Report. Published daily since 2002, the report provides forecasts and analysis of the leading gold, silver, uranium and energy stocks from a short-term technical standpoint. He is also the author of numerous books, including 'How to Read Chart Patterns for Greater Profits.' For more information visit www.clifdroke.com
© 2005-2022 http://www.MarketOracle.co.uk - The Market Oracle is a FREE Daily Financial Markets Analysis & Forecasting online publication.