


Natural Gas Long-term Outlook
Commodities / Natural Gas Jan 13, 2008 - 08:56 AM GMTBy: Elliot_H_Gue

 Natural gas prices have been on a roll in the past few weeks, with the 12-month New York Mercantile Exchange (NYMEX) strip rising to about $8.50 per million British thermal units (MMBtu) this morning, up more than $1 dollar off recent lows.
As I discussed in a post on At These Levels yesterday, the NYMEX strip is the most relevant measure of natural gas prices in the US. On NYMEX, gas futures contracts trade with expirations every month. Prices vary wildly from month to month because of seasonality, expectations of future supply shortages or gluts, and the cost of gas storage, among other factors.
For example, the February 2008 contract currently trades around $8.225 per MMBtu against $9.205 per MMBtu for the February 2009 contract. At any rate, the strip smooths out these variations by averaging the next 12 contracts. Here's a chart of the gas strip going back to early 2002.
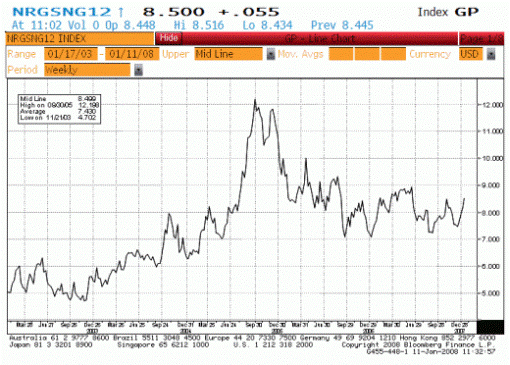
Source: Bloomberg
The pattern is clear on this weekly chart. Natural gas prices trended gradually higher from late 2002 through late 2005 then slumped sharply, reaching a low in the fall of 2006. Since that time, gas prices have stagnated in a narrow band between $7 to $9 per MMBtu.
Despite this most recent uptick, gas prices are still depressed and still trade in the same range as they have since early 2006.This contrasts sharply with the relentless rise in crude oil prices over the same time period to recent record highs. In fact, the relative valuation of natural gas is about as cheap as it's been at any time since 2001-02. To evaluate this, check out the chart of the natural gas/oil ratio.
Source: Bloomberg
I calculated this ratio by dividing the natural gas strip price by the price of West Texas Intermediate crude oil. The lower this line, the cheaper natural gas is relative to crude oil. And, as this chart makes abundantly clear, gas is as cheap relative to crude as it's been in more than a decade.
But just because gas is cheap doesn't necessarily mean a turn is imminent. Eventually, I expect the gas/oil relationship to revert to a more average level, but that reversion could still be some months in the future.
Observant readers will also note that the gas/oil ratio could return to more “average” levels if crude prices fall and natural gas prices hold firm. As I explained in the Nov. 30, 2007, issue, Oil's Going to $70 , I expect a short-term pullback in crude prices. Longer term, however, crude oil is well-supported fundamentally by strong demand growth and shaky supplies; the gas/oil ratio reversion will correct mainly through a rise in natural gas prices above the one-and-a-half-year trading range.
The primary factor holding back natural gas prices is, of course, gas inventories. Gas storage statistics are released weekly by the US Dept of Energy's statistical arm, the Energy Information Administration (EIA). Bloated inventories of gas in storage have capped every rally since early 2006. Check out the chart below for a closer look.
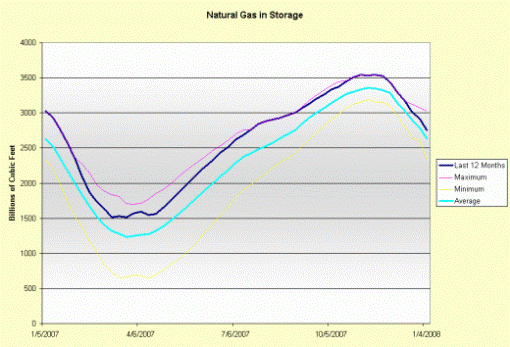
Source: Bloomberg
To make a long story short, natural gas storage levels spent most of 2007 near the high end of this range or actually setting new highs. That glut kept prices depressed.
But note the action at the very right-hand margin of the chart. For the past few weeks, drawdowns of gas in storage have been running at higher-than-average levels. Therefore, natural gas inventories have been falling quickly toward more average levels.
For the US as a whole, gas inventories are now less than 5 percent above average. In the eastern US, the most important consumer, inventories are actually only 0.5 percent above the five-year average. That's only 7 billion cubic feet out of more than 1.5 trillion in storage for that region alone.
This normalization is responsible, in large part, for the recent rally in gas prices. The main driver has been the weather; a cold snap toward the end of December and into the first few days of January has prompted the faster-than-normal drawdowns. Note that the data released today is for the week ended Jan. 4. It doesn't include this week's spring-like temperatures.
Pundits have tried to call the turn in gas prices on several occasions over the past two years; at best, they've caught a short, sharp rally. After all, the natural gas futures market isn't known as “the widow-maker” for nothing. And this week's mini-spring in the Northeast may scuttle the normalization pattern noted above.
However, natural gas storage will be one of the most important energy-related metrics to watch in the next few weeks. If those inventories continue to fall and sink under the average, this will be an important fundamental shift.
It also would raise the point that there's something else at work in this market that goes beyond the temperature in New York, Boston and Chicago. Perhaps we're seeing the first signs that falling Canadian drilling activity, US production cutbacks and falling liquefied natural gas (LNG) imports are having an impact on US supplies.
The jury is still out on gas prices and, for now, I expect gas prices to remain range-bound in the same $7-to-$9 region. But that doesn't mean you can't make money playing gas right now. To play the trend, I'd focus on two key groups: companies with exposure to the build-out of LNG infrastructure and exploration and production (E&P) firms with the scope to grow production in the coming years.
For a closer look at LNG, check out TEL , Sept. 14, 2007, Liquid Energy .
When it comes to gas E&P companies, it may surprise many readers to find out that, even with natural gas prices range-bound and gas inventories still excessive, many gas-heavy E&Ps are trading near all-time highs. One of the key differentiators is the ability to grow production. Check out the chart below.
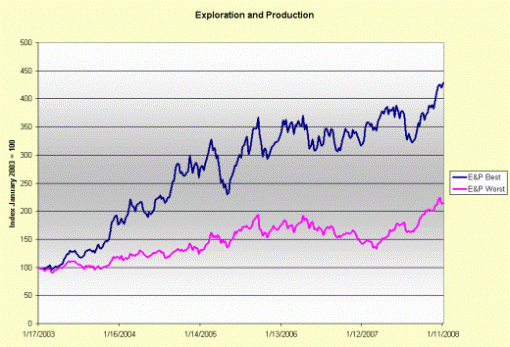
Source: Bloomberg
To make this chart, I simply took a list of about 35 independent E&P firms with exposure to natural gas. I then calculated their total production growth over the past five years in terms of annualized growth in barrels of oil equivalent production.
I then sorted this list from the fastest growers to the slowest. The index labeled "E&P Best" is an index of the raw price performance of the three E&P firms with the strongest production growth over the past five years. The index labeled "E&P Worst" is, as you may have already guessed, an index of the three worst performers on a production-growth basis.
The conclusion is obvious: Over the past five years, the companies managing the fastest production growth have outperformed the slowest growers by a margin of 2-to-1. Therefore, if you can ascertain which E&P firms are best positioned for growth, you'll ascertain the likely outperformers.
Of course, I calculated this index with the benefit of 20/20 hindsight. However, that doesn't mean that we can't evaluate a firm's ability to grow production. An understanding of the areas where an E&P firm operates, their drilling plans and, of course, the type of reserve they're exploiting offer a lot of clues about production growth potential.
The reason I recommend focusing on select E&Ps and LNG plays is that they've been performing well despite range-bound gas prices. Some of my favorite natural gas-focused E&Ps are up 30 to 50 percent just since last summer.
Therefore, if this really is the beginning of the long-awaited turn in gas, I expect these firms to see a pop. But if it isn't, you can still see some pretty impressive gains.
By Elliott H. Gue
The Energy Letter
© 2008 Elliott H. Gue
Elliott H. Gue is editor of The Energy Letter , a bi-weekly e-letter as well as editor of The Energy Strategist , a premium bi-weekly newsletter on the energy markets. Mr. Gue is also associate editor for Personal Finance , where he contributes his knowledge of the energy markets.
Mr. Gue has a Master's of Finance degree from the University of London and a Bachelor of Science degree in Economics and Management from the University of London , graduating in the top 3 percent of his class. Mr. Gue was the first American student to ever complete a full degree at that university.
Elliott H. Gue Archive |
© 2005-2022 http://www.MarketOracle.co.uk - The Market Oracle is a FREE Daily Financial Markets Analysis & Forecasting online publication.