


Stocks Bear Market Focus Point: Bull Trap warning – Precious Metals, the first casualty
Stock-Markets / Stocks Bear Market Apr 25, 2012 - 04:26 AM GMTBy: Garry_Abeshouse

 Gold has always been a bit of a conundrum for me as I am never quite sure how this yellow metal should be classified. According to Geology.com, “Of all the minerals mined from the Earth, none is more useful than gold. Its usefulness is derived from a diversity of special properties. Gold conducts electricity, does not tarnish, is very easy to work, can be drawn into wire, can be hammered into thin sheets, alloys with many other metals, can be melted and cast into highly detailed shapes, has a wonderful colour and a brilliant lustre. Gold is a memorable metal that occupies a special place in the human mind.”
So how should we look at gold as it is traded on the world’s financial markets?
Gold has always been and will always be an elemental source of value to humans and an important hedge against inflation and adversity. However, when DEFLATION threatens, gold is abandoned, albeit temporarily, as it was in 2008, when it fell from a spot price high of USD$1033.00 to a low of USD$681.00 – a fall of about 34%. It is now April 2012 and DEFLATION is rearing its ugly head again, so how should we look at gold now?
Now that the global economy is so large and the financial mechanisms that allow it to function are so obtuse and complex, even to consider the whole world should be put on some sort of pre 1971 style “Gold Standard” would not just be inconceivable – it would be unworkable. It is simply not on and it is highly unlikely ever to happen – although a reformed, simplified and more open system of financial regulation would be highly desirable.
Gold as traded on the world financial markets also comes with a huge amount of emotional baggage. These emotional associations with gold make sure that physical gold, gold futures, gold stocks and gold ETF’s remain highly price volatile and are traded in huge volumes. All this makes traded gold entities as a collective group, an extremely important, but sometimes erratic, financial barometer of deflationary and inflationary market sentiment. Over time I have learned to appreciate the utility of this association as I analyse the markets.
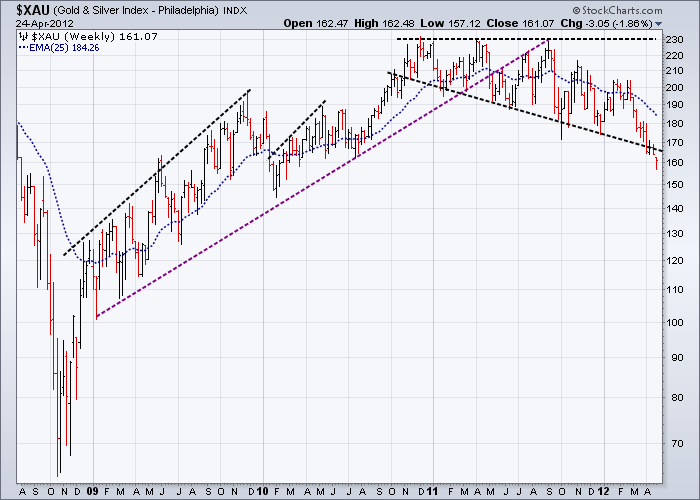
Gold stocks have been the first casualty of the current Bull Trap in the financial markets
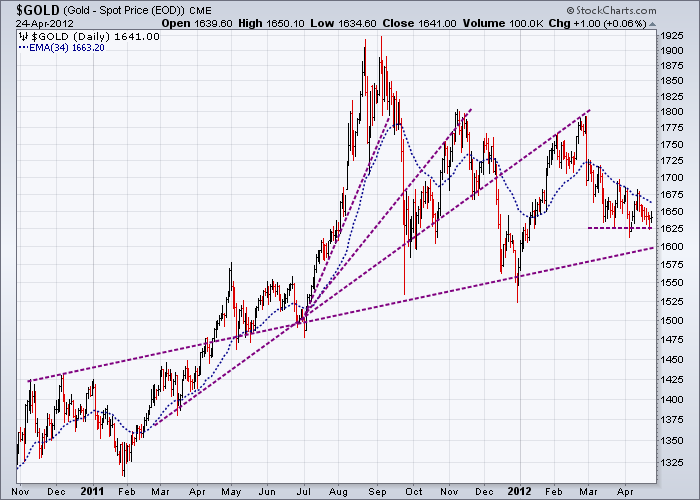
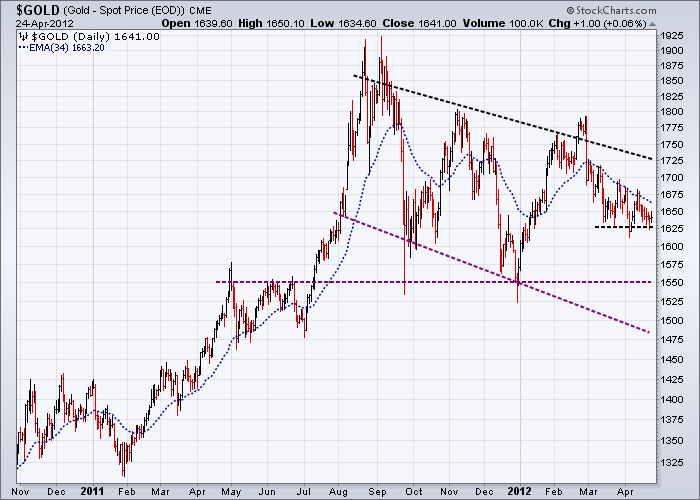
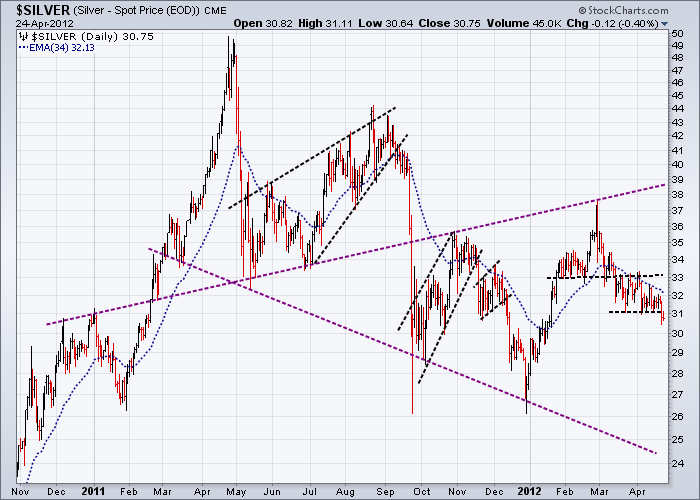
The two spot gold daily charts immediately below are good illustrations of how trend lines may be drawn in different ways to help understand the implications of current market action. In the first chart, it can be seen how the four fanning out uptrends and consecutive lower highs over the last nine months are suggesting increasing weakness. The second chart has an ominous looking descending triangle sitting above the USD$1550 support level. These two charts, coupled with confirmed support breaks in the heavyweight stocks and indices on the other charts below, indicate that we are probably even now, in the early stage of a new deflationary phase.
To me the charts below also imply that future falls in gold and silver prices in USD terms, may even be larger than those that occurred in 2008. This scenario would be contingent upon further confirmation of a topping out and downturn in equities, combined with substantial weakness of the major currencies against the USD. One way or another, with short term spot gold sitting very close to important support lines as we speak, there is certainly very little room to move.
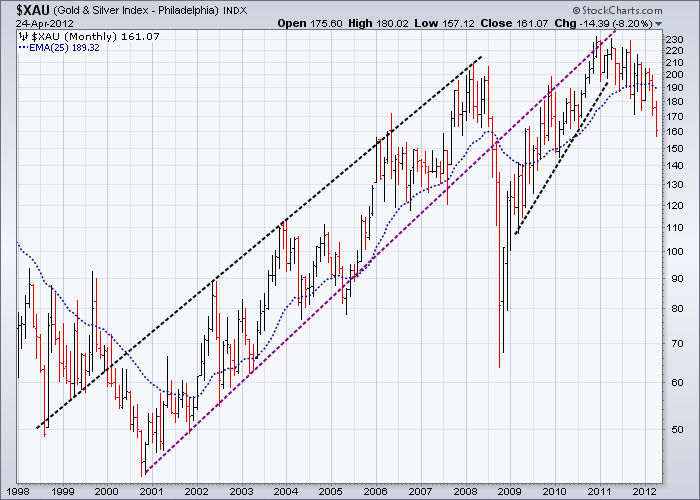
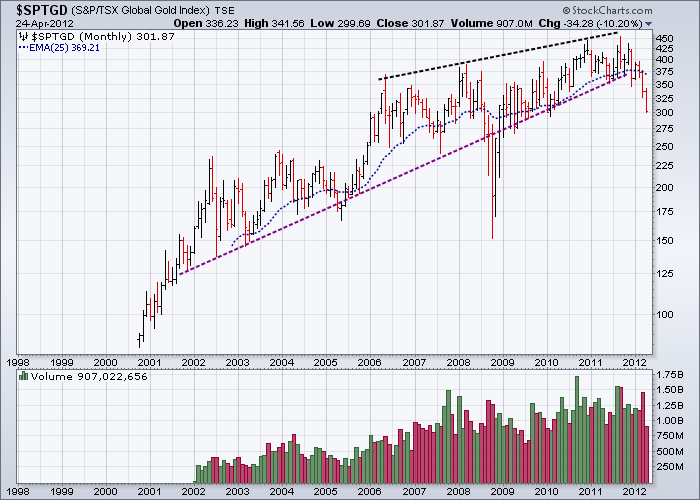
In this deflationary scenario, as with all future scenarios, the fate of all financial markets are inexplicitly linked together.
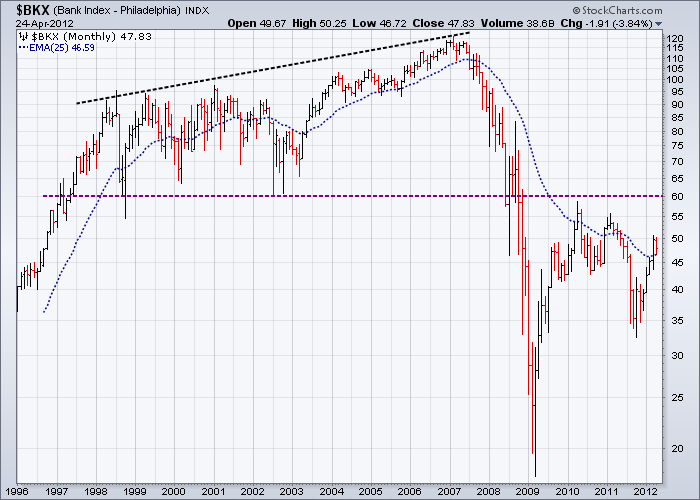
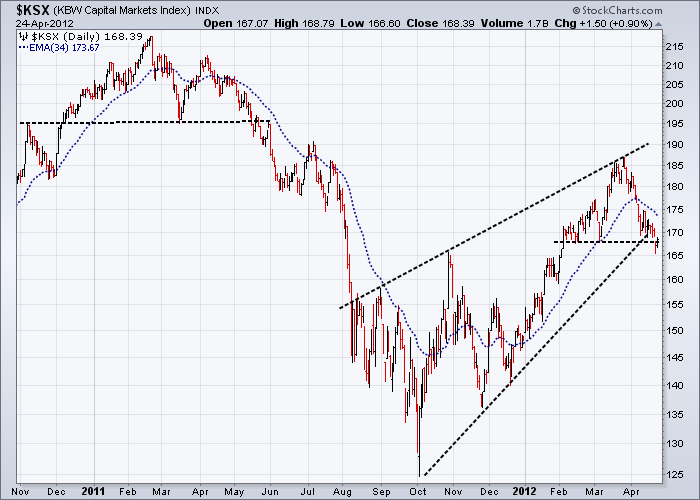
With this in mind, I have added two charts from the banking sector to ground the deflationary scenario we now find ourselves in into a broader context.
In my October 3rd 2011 commentary I reproduced two monthly charts - the Philadelphia Bank Index and the S&P 500 Diversified Financials Industry Group Index. My comment at that time was:
“These two charts underline the story I have been trying to convey to my readers for just on two years now. These two charts are the most important ones here, as the bearish patterns have advanced to the point where they are almost impossible to reverse.
Both these Indices show identical well-defined 10 to 11 year broadening tops, with solid breaks below their necklines in 2008/2009 and pullbacks to their necklines over the last two years. This is classical text book pattern recognition and Technical Analysis at its most obvious – and all but ignored by analysts. Prices have already collapsed below the recent two year support indicating a return to what will probably be a testing of the 2009 lows. It is very difficult to even try and imagine a longer term bullish scenario for these two charts, even if there is a stronger rally from here.”
Despite the froth and bubble associated the new Apple products over the last seven months, my bearish view concerning the financial markets has strengthened rather than diminished. Nothing has changed in these two charts to alter this view. On the contrary, the consecutive lower highs over the last two years on the Banking Index monthly chart and the break below support on the KBW Capital Markets Index (an almost equal weighted Merchant Banks Index) daily chart, highlight the delicate nature of the financial markets at the moment.
It will be interesting to see how good Obama and his friends are in keeping the financial markets in positive territory over the next few months. Personally I think they will have a tough fight on their hands in the light of what I see here.
My favourite spin headline of the week is Barron’s Online headline from just three days ago:
“This Weekend's Barron's: Big Money Poll Finds Money Managers Are Bullish”
Till next time.
Garry Abeshouse
Technical Analyst.
Sydney
Australia
I have been practicing Technical Analysis since 1969, learning the hard way during the Australian Mining Boom. I was Head Chartist with Bain & Co, (now Deutsch Bank) in the mid 1970's and am now working freelance. I am currently writing a series of articles for the international "Your Trading Edge" magazine entitled "Market Cycles and Technical Analysis".
I specialise in medium to long term market strategies.
© Copyright Garry Abeshouse 2012
Disclaimer: The above is a matter of opinion provided for general information purposes only and is not intended as investment advice. Information and analysis above are derived from sources and utilising methods believed to be reliable, but we cannot accept responsibility for any losses you may incur as a result of this analysis. Individuals should consult with their personal financial advisors.
© 2005-2022 http://www.MarketOracle.co.uk - The Market Oracle is a FREE Daily Financial Markets Analysis & Forecasting online publication.