


Is the Stock Market Correction Over?
Stock-Markets / Stock Markets 2012 Apr 30, 2012 - 06:05 AM GMTBy: Andre_Gratian

 SPX: Very Long-term trend - The very-long-term cycles are down and, if they make their lows when expected (after this bull market is over) there will be another steep and prolonged decline into late 2014. It is probable, however, that the steep correction of 2007-2009 will have curtailed the full downward pressure potential of the 120-yr cycle.
SPX: Intermediate trend - The intermediate uptrend is still intact and the short-term correction could be over.
Analysis of the short-term trend is done on a daily basis with the help of hourly charts. It is an important adjunct to the analysis of daily and weekly charts which discusses the course of longer market trends.
Market Overview
After last week's SPX performance it's possible that the market correction is over. The cycle low which was ideally due for next week may have come in about a week early, and could have been responsible for the spike down to 1359 and the subsequent rally. This would mean that the 1357 low of 4/10 has held and that the SPX could see higher prices before it is challenged again.
With this market action, my former scenario may have to be modified. The rally which started at 1359 last Monday met its initial Point & Figure projection of 1405 on Friday. It's a good bet that we could get a correction now that this target has been reached. The type of correction will decide whether the cycle has truly bottomed early, or if it is still ahead of us. The reason why this is not certain is because there are other current cyclical factors which could explain the market's behavior.
EW analysts are divided on the current structure. The view that 1359 was the end of wave 4 and that wave 5 is now underway is meeting with skepticism by those who believe that the corrective action which started at 1422 is not over. How the SPX corrects from 1405 should go a long way toward clarifying the structure.
Should this be the beginning of wave 5 from 1359, we should have just completed wave 1 of 5 at 1405 on Friday. After a corrective wave 2, the next wave should take us to about 1424/1427, and there is the potential for an ultimate move to about 1450. A P&F projection to that level is confirmed by several Fibonacci calculations -- providing the SPX can rise above 1422. If the SPX cannot get above that level, it would force us to consider that we may only be dealing with an extension of the correction.
Supporting the bullish case is the fact that the NYSI has turned up, which means that the McClellan oscillator is again positive, and VIX appears to have broken down after a failed attempt at resuming its uptrend. Also bullish is the fact that the NDX made an island reversal after making its low.
The bears point to the light volume behind the rally, and the decreasing breadth momentum over the last two days. They also see the VIX in a consolidation pattern, ready to resume its uptrend at any time.
This difference of opinion will hopefully be resolved over the next week. The second round of the French election on May 6 could cause a wait-and-see attitude on the part of traders. Hollande's showing in the first round on April 21 caused a serious sell-off in the markets the following Monday. Should Hollande be the winner, will the market sell off again, or has this already been discounted?
Chart analysis
The two most notable features of this Daily Chart of the SPX are that the uptrend remains contained within a channel and that, according to the indicators, a buy signal was given three days ago.
After the sell signal which occurred on 4/4, the index quickly found a low at 1357 and subsequently moved in a sideways trading pattern. Last Monday, the previous low was tested, but found support on the bottom channel line and began a reversal which managed to break above the former high of the corrective pattern. That puts the SPX back in a near-term uptrend which is currently supported by the various MAs and oscillators. Not shown on this chart - but we'll analyze it later - the McClellan oscillator also initiated a near-term buy signal. That makes it unanimous for the near-term.
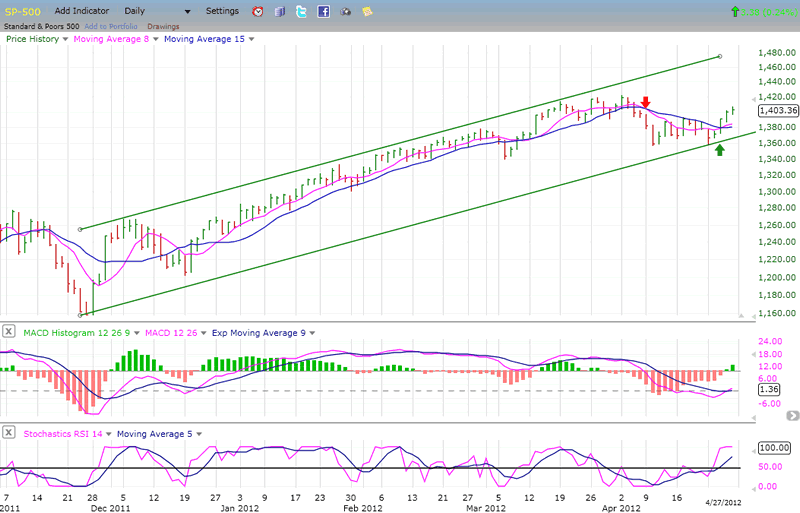
So far, so good for the bulls. However, although the rally managed to overcome the 1393 resistance level at Friday's closing price of 1403, it still remains nineteen points below the late March high of 1422. If this is a bona fide resumption of the intermediate trend, the SPX will have no problem rising beyond 1422, thereby opening the way for an extension of the move to about 1450. Since the index has achieved its initial price projection to 1405, we will have to see if that's all the bulls can muster, in which case, it will remain in a corrective phase.
Before we get carried away with last week's apparent bullishness, let's look at the Hourly Chart.
Here, the main uptrend channel is roughly divided in quartiles. Before the correction started, the SPX was trading in the upper quartile. When it broke, it plunged into the bottom of the second quartile, where it consolidated for a while, before briefly dipping into the bottom of the first quartile in which it spent only a couple of days before moving back to the top of the second quartile.
With the MACD histogram retracing almost to zero, and the SRSI giving a sell signal by the close on Friday, it looks as if this is all we get on the upside for now. Also, the P&F projection for the accumulation which occurred in the first quartile - well-defined by vertical poles on each side - gave a target of 1405. On Friday, the SPX touched 1406 but could go no further and started to back off. There was enough loss of momentum for the lower oscillator to give a sell signal.
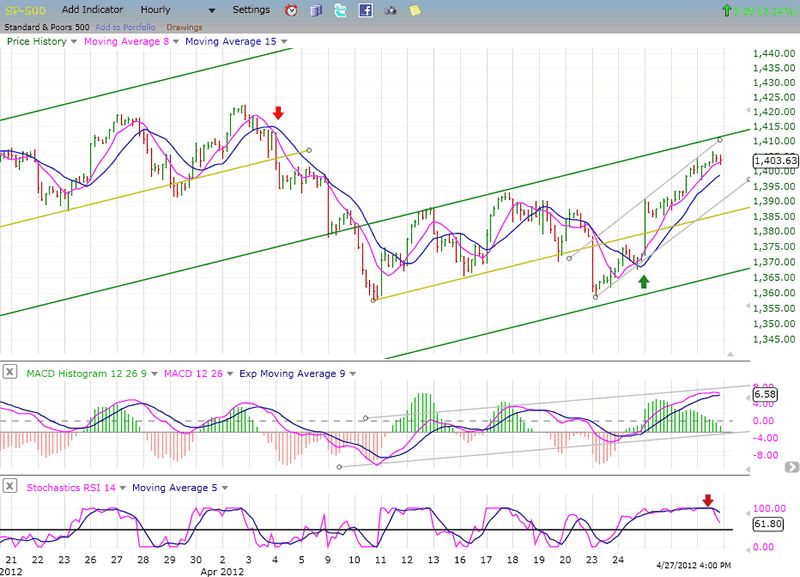
If the SPX is truly finished with its correction and ready to continue its intermediate uptrend, this chart should give us the clue. What it must do is hold in the second quartile and move past its mid-channel line with rising volume and improved A/D statistics. Only then will we be able to ascertain that it is engaged in a genuine attempt at re-establishing its intermediate uptrend. How the index corrects from here will clarify the market's intention.
Cycles
"The only cycle that really counts at this time is a 29-30-wk cycle which has produced regular phases for the past three years." This is what I wrote a week ago.
The market action suggests that this cycle made its low about a week ahead of time... and then, perhaps not! There are two smaller cycles which are active in this time frame: one which may have made its low on 4/23, and the other which made a high on 4/27. If that's the case - and if the low of the larger cycle is still ahead of us, we should see a sharp decline over the next few days. If this does not occur and there is only a mild correction from 1405, it will be a confirmation that the bigger cycle has already bottomed.
There could be an important cycle (top?) on 5/20 and a (hi/lo?) on 6/15. The market action should tell us which to expect.
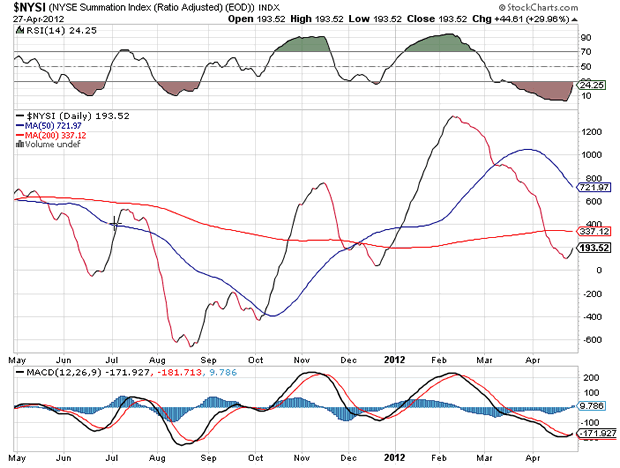
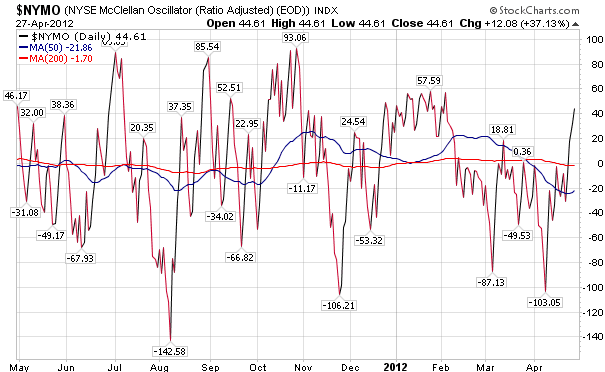
Breadth
The NYSE Summation Index and the McClellan oscillator (courtesy of StockCharts.com) are shown below. After a long stint in the negative, the McClellan oscillator has turned positive, and this has reversed the trend of the NYSI. Its RSI has started to come up but is still negative. If the RSI reverses before it gets to 70, it will be a sign of market weakness.
Sentiment
VIX
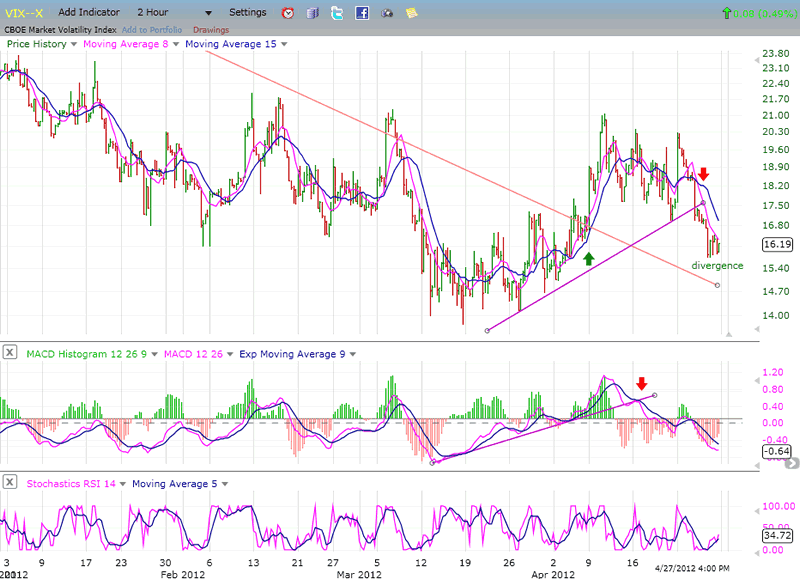
The VIX broke out of its long-term down-trend line - after showing some positive divergence - at the same time that the SPX started to reverse after reaching 1422. During the market consolidation, the VIX countered with one of its own, but when it broke its short-term uptrend line, it was a sign that the correction of the equities could be over.
Just before the SPX started to reach its 1405 projection on Friday, the VIX started to show some minor positive divergence. This should be a sign that the SPX will pause at this level and have a correction. The nature of this correction and the corresponding behavior of the VIX during that time should give us some clues as to whether we have started to resume the uptrend in earnest or if we are in the process of extending the correction.
XLF (Financial SPDR)
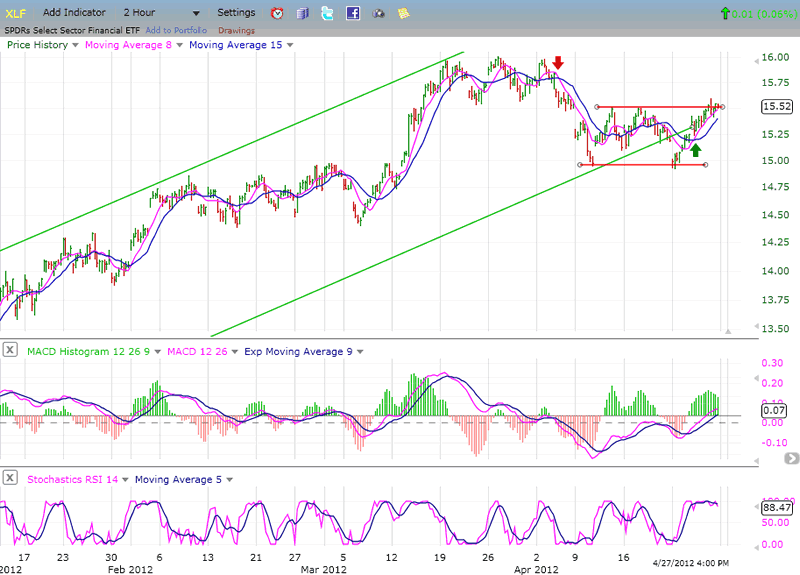
I mentione before that the XLF can serve the same purpose as the VIX by alerting us of a potential reversal in the SPX, but the warnings are far more subtle. For instance, the SPX made a higher high on its third top when it reached 1422, but the XLF did not. Soon after, a reversal took place.
Last week, the XLF gave a short-term buy signal along with the SPX, but let's look at what else it is saying! When the SPX re-tested its 1357 low, so did the XLF, but in doing this, it moved substantially outside of its uptrend channel. During the bounce which followed, it has barely moved back above its lower channel line, while the SPX is still trading inside it. Also, the XLF barely nudged above its overhead resistance, but the SPX closed well above it. This is negative divergence which suggests caution to the bulls.
Even more so than the VIX, the XLF is not confirming the strength in the SPX. Nor, for that matter, is the QQQ which remains relatively weaker than its counterpart. I don't know if this means that the SPX needs more consolidation (or correction) before re-establishing its uptrend, but the analysts that are saying "show me!" have good reasons to be skeptical.
BONDS
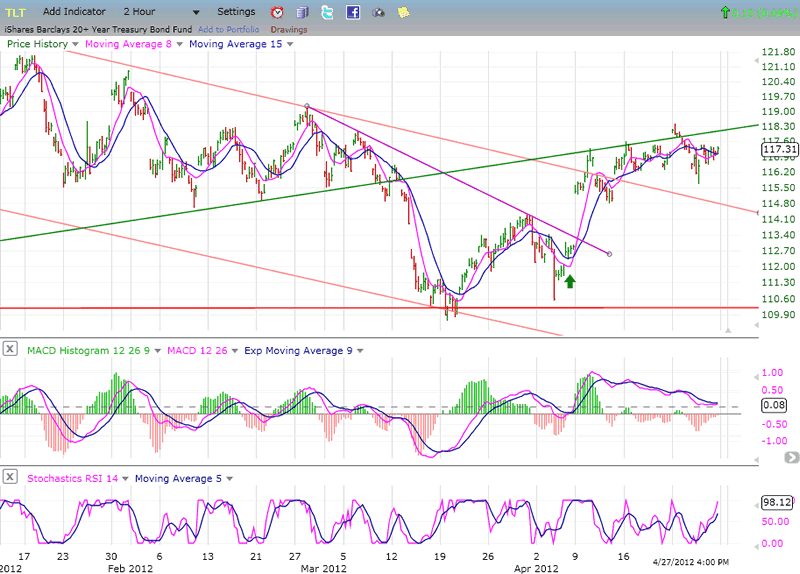
This is another index which seems to be doubting the rally in equities. If it were genuine, you would think that TLT would be selling off, but it is not. Instead, it seems to be waiting for the SPX to show more weakness so that it can attempt to rally above its former support line (turned resistance) once again.
After meeting its long-term projection at 124, TNT underwent what looks like a substantial distribution phase, and when it broke below its long-term uptrend mid-channel line, it looked as if it was all over and a substantial decline had started. This would have implied that stocks would be moving higher. Instead, TLT is not so sure that equities are about to move back up right away, and it seems to be waiting for another opportunity to re-gain its position in the upper half of its long-term channel.
UUP (Dollar ETF) Daily Chart
The cycle which normally causes a short-term high or low in this index must have been overridden by a larger one because it had been very regular for quite some time and, this time, UUP extended its low at least five days beyond its normal phase. However, the MACD is showing some minor divergence and the SRSI has turned up. This could mean that the UUP is about to rally, in conjunction with a market retracement.
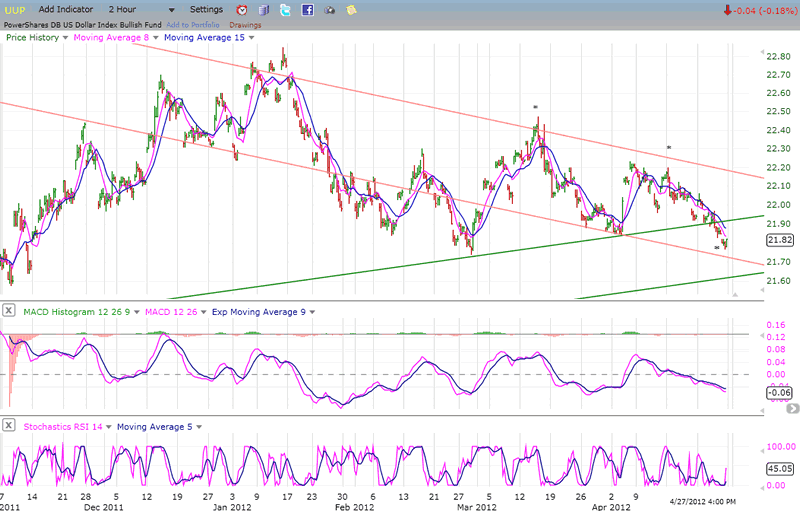
For a truly meaningful reversal, UUP would have to overcome its former near-term high and rise decisively above the parallel to its longer-term upper channel line which was broken in December of last year. For now, it seems content to use it as support and bounce off it whenever it is reached -- something which it appears ready to repeat.
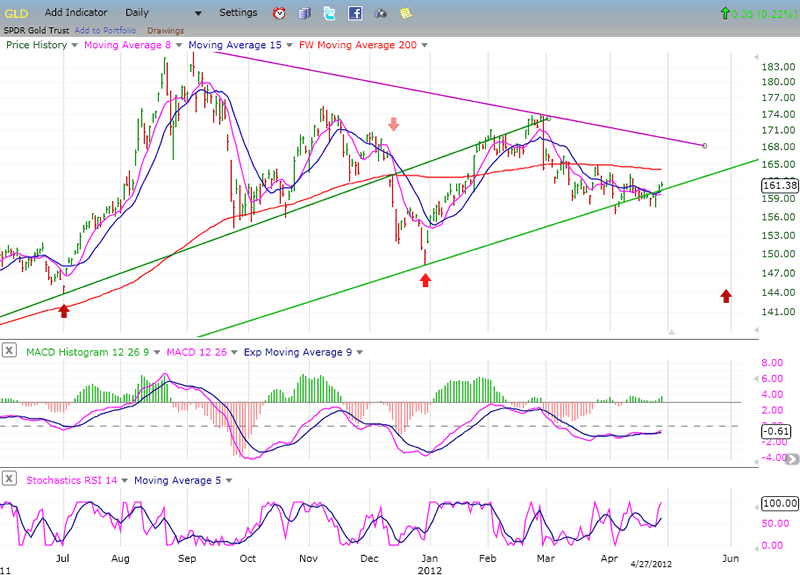
GLD (ETF for gold)
Since meeting its long-term target of 185, GLD has been in an intermediate consolidation pattern which does not appear to be complete. After breaking its long-term trend line, it found support at a former low and mounted a strong rally which ended as a back-test of the broken trend line.
Since then, GLD has been in a lazy downtrend which has found support on a second trend line drawn across its second retracement low. It cannot stay there forever and must either get back in an uptrend, or break through the trend line. Since it is trading below its (front-weighed) 200-MA (red line).
It may not have the strength to move back above it until it has declined further into the low of its 25-wk cycle which has a good history of causing declines as it bottoms, followed by a significant short-term rally.
Should GLD break down before moving higher, it has a good chance of trading down to about 141 by the time the cycle makes it low.
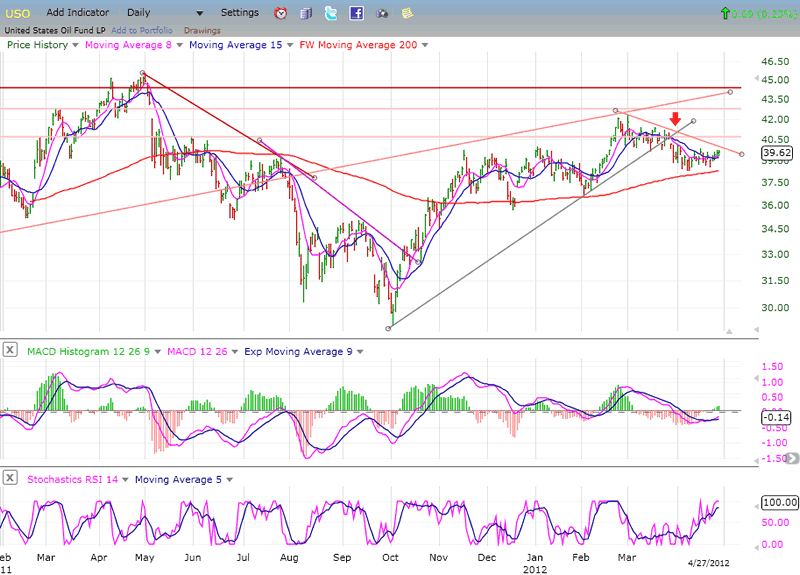
OIL (USO)
The chart of USO is also casting doubts of the ability of the SPX to have a serious up-move right now.
From the October low, USO engaged in a strong uptrend - along with all equity indices - until it met with severe resistance when it reached the underneath portion of a broken long-term trend line, along with a resistance band caused by former tops. This initiated a decline almost a full month before the SPX reached its high of 1422.
As of Friday, USO did not show any inclination to join the SPX in an attempt to resume its uptrend. It may simply be a late-comer and eventually join the crowd if the market as a whole follows through on its initial bounce, but for the time being it seems content to be part of the "show me!" crowd.
Summary
Last week, after a sharp decline which fell just short of is previous short-term low of 1357, the SPX bounced back with a sharp rally of 47 points, which many believe to be the start of another bullish phase destined to make a new high.
This is possible but, as I pointed out above, there appears to be enough skepticism coming from various areas that adopting a wait-and-see attitude is warranted. The issue probably rests on whether or not an important cycle has already made its low.
FREE TRIAL SUBSCRIPTON
If precision in market timing for all time framesis something that you find important, you should
Consider taking a trial subscription to my service. It is free, and you will have four weeks to evaluate its worth. It embodies many years of research with the eventual goal of understanding as perfectly as possible how the market functions. I believe that I have achieved this goal.
For a FREE 4-week trial, Send an email to: ajg@cybertrails.com
For further subscription options, payment plans, and for important general information, I encourage
you to visit my website at www.marketurningpoints.com. It contains summaries of my background, my
investment and trading strategies, and my unique method of intra-day communication with
subscribers. I have also started an archive of former newsletters so that you can not only evaluate past performance, but also be aware of the increasing accuracy of forecasts.
Disclaimer - The above comments about the financial markets are based purely on what I consider to be sound technical analysis principles uncompromised by fundamental considerations. They represent my own opinion and are not meant to be construed as trading or investment advice, but are offered as an analytical point of view which might be of interest to those who follow stock market cycles and technical analysis.
Andre Gratian Archive |
© 2005-2022 http://www.MarketOracle.co.uk - The Market Oracle is a FREE Daily Financial Markets Analysis & Forecasting online publication.