


Stock Market MAP Analysis - Russell Update 30 April
Stock-Markets / Stock Markets 2012 Apr 30, 2012 - 09:24 AM GMTBy: Marc_Horn

 Following last weeks update I feel that it is important that some parameters are explained to avoid comment updates which are behind the price movement. As a result I have changed the format slightly with the addition of expected movement limits on various time scales, and will update my big pictures to include these. I also feel that users should have a better understanding of the parameters and as such last week published an explanation of MAP wave basics http://www.marketoracle.co.uk/Article34332.html , and will be adding more detail over the coming weeks. Part 2 is in final edit and hopefully will be ready by the end of the week. To get updates of my analysis please just click follow on my blog.
The MAP Wave counts are as shown on the charts.
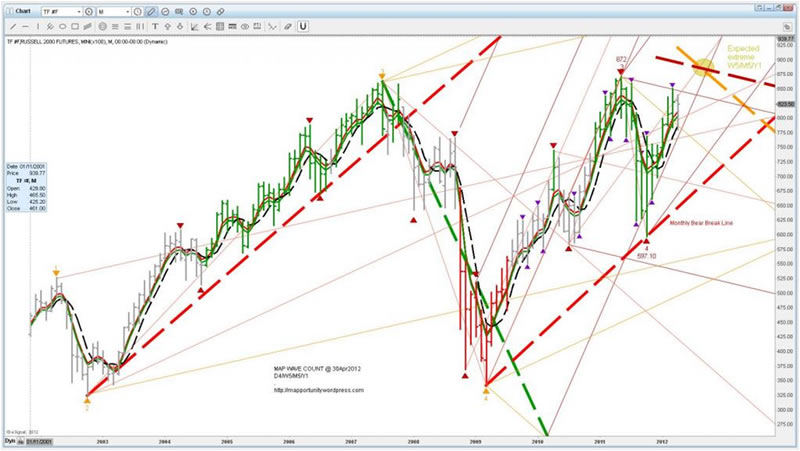
I am expecting a final top later this year to complete a valid MAP Wave count later this year in the area shown of the gold circle. That would complete a valid MAP Wave count from the 1980's lows.
The weekly chart below shows the MAP Wave detail off the October 2011 bottom.
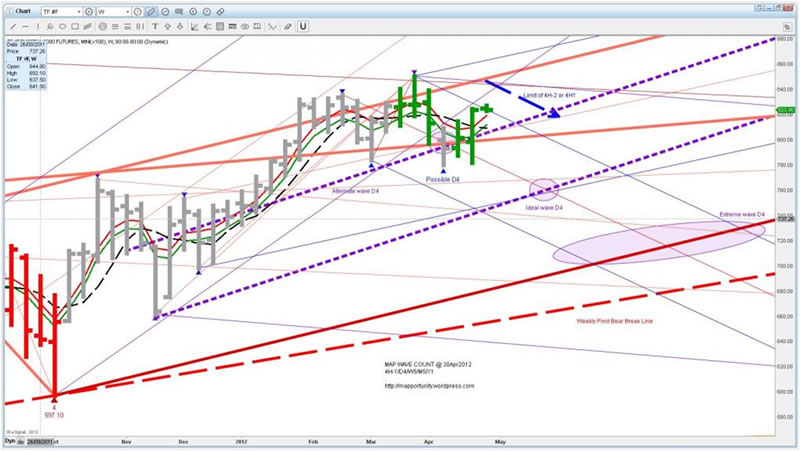
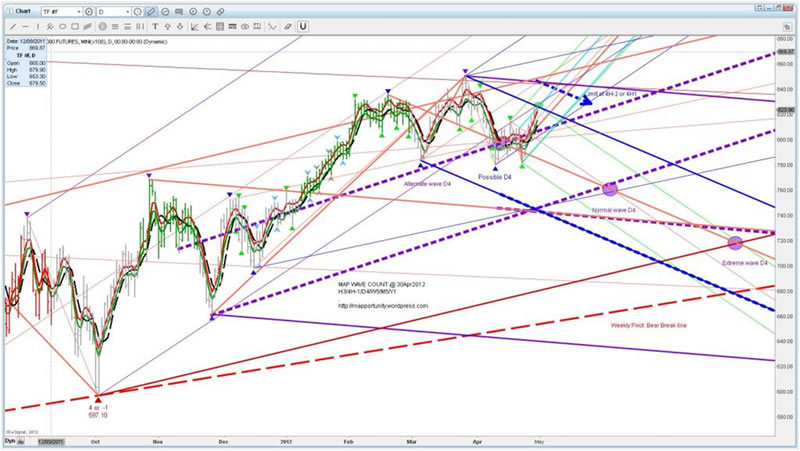
A clear 5 wave pattern can be seen from D2 to D3 (purple pivots). The 10 April low is at least a 4H pivot, but also a possible alternate cycle D4. I am expecting a retest of the recent high at the dashed blue line labeled "Limit of 4H-2 or 4H1". A clear break of that high would confirm that last weeks low is D4. I also show the purple circle as the ideal wave D4 target as well as extreme wave D4 target. You can see todays high has pierced the MLU and so it is possible that this is the retest as 4H-2, however when we look into the daily scale below that it is more likely to be H3/4H-2. Either way it is expected that there will be a down move from here for a day or two.
If we look at more detail we can apply the same principles to provide trading parameters and targets for the hourly pivot scale.
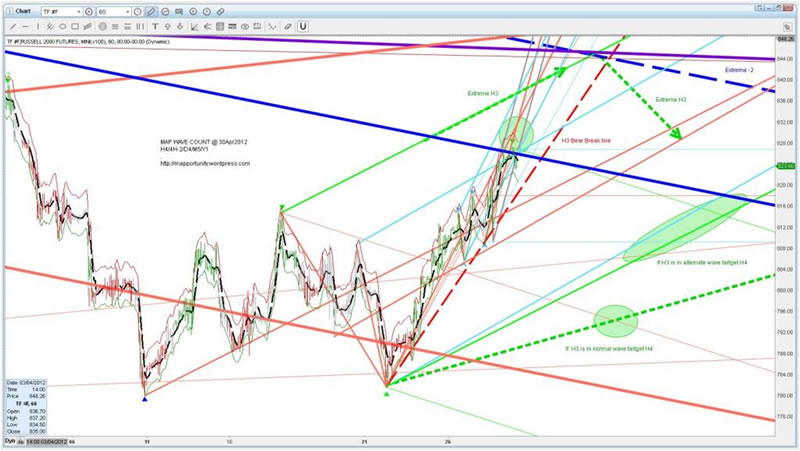
So it looks highly probable that we shall start with a down turn and make pivot H4 by the end of the week.
For more information of how I do what I do http://mapportunity.wordpress.com/ . Comments and discussions very welcome!The statements, opinions and analyses presented in this site are provided as educational and general information only. Opinions, estimates, buy and sell signals, and probabilities expressed herein constitute the judgment of the author as of the date indicated and are subject to change without notice.
Nothing contained in this site is intended to be, nor shall it be construed as, investment advice, nor is it to be relied upon in making any investment or other decision.
Prior to making any investment decision, you are advised to consult with your broker, investment advisor or other appropriate tax or financial professional to determine the suitability of any investment.
© 2012 Copyright Marc Horn - All Rights Reserved
Disclaimer: The material is presented for educational purposes only and may contain errors or omissions and are subject to change without notice. Readtheticker.com (or 'RTT') members and or associates are NOT responsible for any actions you may take on any comments, advice,annotations or advertisement presented in this content. This material is not presented to be a recommendation to buy or sell any financial instrument (including but not limited to stocks, forex, options, bonds or futures, on any exchange in the world) or as 'investment advice'. Readtheticker.com members may have a position in any company or security mentioned herein.
© 2005-2022 http://www.MarketOracle.co.uk - The Market Oracle is a FREE Daily Financial Markets Analysis & Forecasting online publication.