


Turning Andrews Pitchforks into Predictable MAP Cycle Forks, MAP Analysis Part 6
Stock-Markets / Stock Markets 2012 May 16, 2012 - 06:07 AM GMTBy: Marc_Horn

 Apology – after re-reading it comes across as all analysis is rubbish except for mine. There is good analysis and bad analysis but I am trying to point out there is a difference between systematic and random. Using systematic analysis you can constantly revise and improve your analysis, where as if you are not systematic and object and draw random lines here and there to substantiate your feeling – that depends on which way the wind blows.
Any analyst that can demonstrate that through a systematical approach rather than random waffle and changing trend lines as the picture develops analysis, I will give permission to use any and all my IP and Copyrighted materials free of charge.
The concept is to reduce vulnerability by customers that are ignorant (NOT STUPID) in a highly specialized field that they entrust their future dreams on.
Those with the knowledge and position have a social duty of care if we want society to improve for all, rather than those in control of power!
In MAP Waves Part 1 and Part 2 I demonstrated a systematic approach to wave counting as a high probability method on multiple pivot scales using the foundation stone of all Elliot Wave theory – the motive wave. This overcomes the short comings in the industry of the current practice of the use of endless corrections possibilities that leave a 50% chance of prices going up or down.
In MAP Analysis Part 3 I discussed very basic wave theory where it was viewed in the context of predictable cyclical human behavior. I have also correlated much common technical analysis pattern terminology in relation to Elliot’s motive wave so that from quick pattern association we can increase our probabilities of determining where prices are heading.
In MAP Analysis Part 4 I provided an example of the basic trading lines that, if applied to the correct pivots, provide a probabilistic wave trading model, as opposed to random trend line analysis which is so commonly practiced in the industry currently.
In MAP Analysis Part 5 I reinforced my belief that the driver of the cycle is predictable human behavior, of which the primary levers are ignorance, greed and fear, and through understanding our natural reactions we can break our cycle of predictability and stop being profited on by others, and we can profit from peoples predictable behavior. Andrews and Babston amongst others used Newton’s Action and Reaction theory as explanation of price movement.
In this part I want to present how Alan Andrews simple pitchfork can be used in conjunction with Elliot’s motive wave to provide a highly predictive as well as probabilistic trading model with a wealth of information which far exceeds the best technical indicators and you can see why understanding you trading scale is critical to your success! What does long term, medium term, or short term mean? Are prices going to go up then down in your term? Can you live with that variation and not panic?
More importantly I hope to highlight that using a methodology that is over 100 years old demonstrates that governments STILL are not able to control the economy under any economic model practiced! I use the word practiced because the simple Keynesian Model they have been claiming to follow has NOT been followed. It says put aside in the good times to stimulate in the bad. Because of people’s predictable behavior “vote for me if I don’t give you a tax cut”, or “vote for me and I will give you a tax cut”! Who would you vote for?
To reduce my risk of being one of the 3P’s I have said I only trade indices. That way I overcome becoming a victim of share pumping, dumping or any other third party marketing schemes as well as false and misleading advertising.
That way I also reduce the risks associated with the insider information and regulation as amply demonstrated by the JPM results and its subsequent 7% drop on the news!
So I will use the SPX to demonstrate how using probabilistic pivot combinations as derived in the complete MAP series analysis presented (and outlined in The Euro as an example of my Techniques) so far on different time scales you can fulfill your duty of social responsibility to reduce your risk of being taken for the 3P’s and vote with your money to get peaceful change!
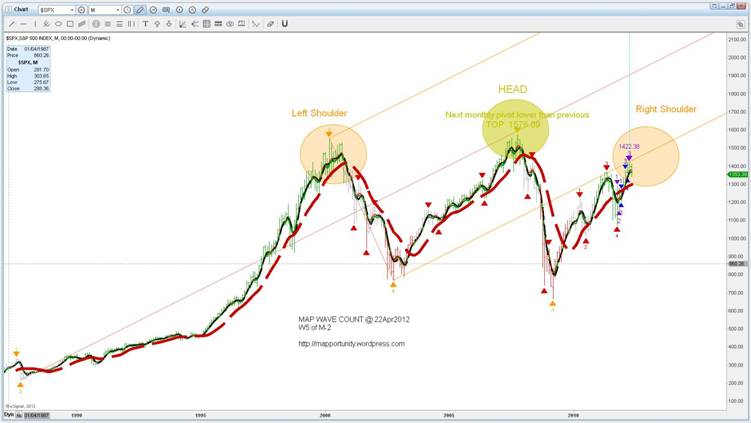
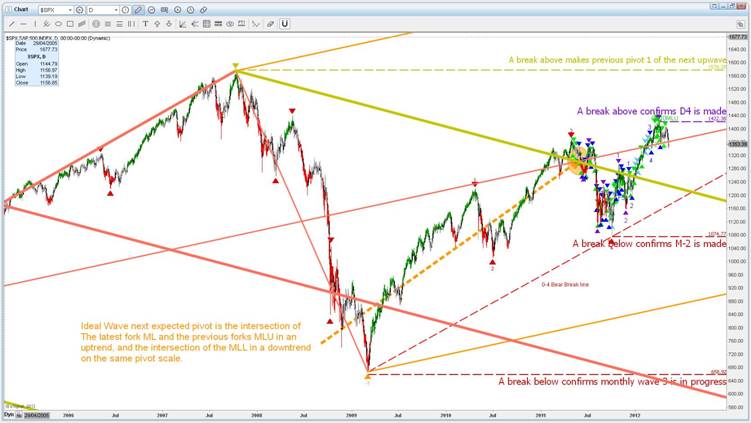
Andrews claimed that 80% of the time prices reverted to the ML. I use the forks on the same pivot scale to see what to expect on that pivots scale, so in this case monthly (orange) pivots 1,2 and 3 (The pivot numbering is in accordance with Elliot’s foundation stone – the motive wave). So we start with a failure?? Or do we? Those that have understood the basic cycle theory presented based on the 3P’s. know that there is interaction between waves when they meet at a point time. So the basic fork actually is giving us the ML of interacting waves. I am sure Alan Andrews was fully aware of this, and dealt with it in terms of action and reaction (as opposed to my human behavior cycle) and he devised rules to adjust the forks such as the modified Schiff fork, warning lines and sliding parallels to name but a few! I am sure given our technology, and much like Elliot would have come to the same conclusions that I am suggesting! His original course is available free on the internet. Just do a search for Alan H Andrews – there is a gold mine of free information!
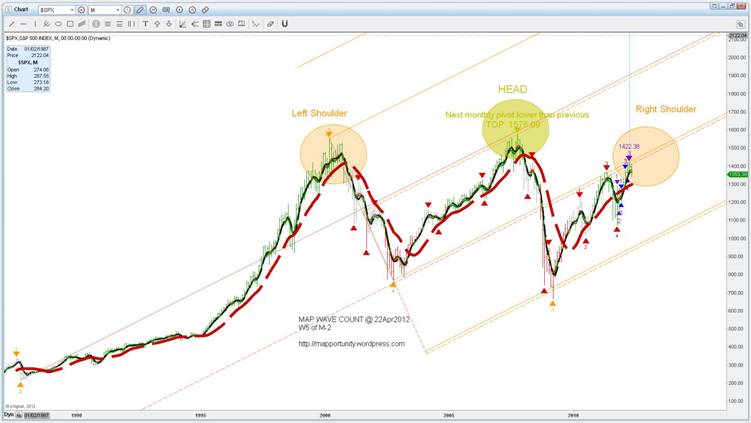
If we draw in the sliding parallel (SP) and warning line (WL) 1 we get the following which reinforces what I said in above highlighting the importance of using pivots methodically if you want to derive information from them – you need a system whereby you can apply probabilities rather than just drawing random lines!
Once the next same pivot scale pivot is made, we then draw in the new fork as shown below joining the last 3 pivots. This gives us the ideal wave target where the ML (median line) and the MLL (Median line lower parallel) intersect as highlighted with the orange circle, which is clearly not possible so we have the ideal wave target as shown near the SP and WL1 intersection with the 345 (fork pivot definition points) ML. You will also notice that I have used a gold fork for the 345 fork – because under EW motive waves I have high probability end top on this scale as the monthly pivot -1 is lower than pivot 4.
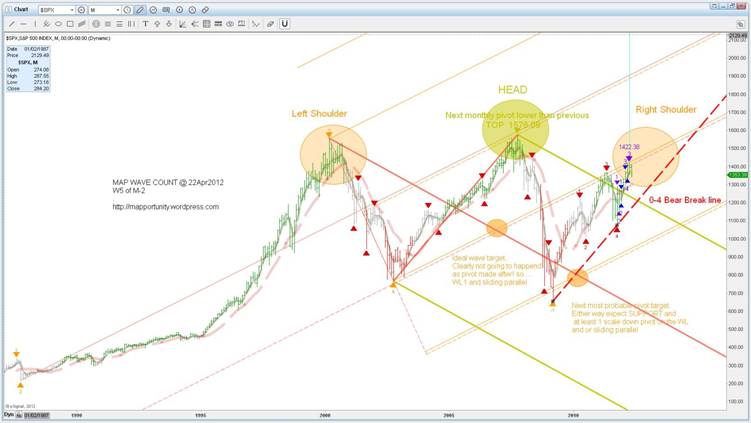
The 345 fork is in the direction of the expected new trend which is down. The 345 fork has a very high probability of pivot 1 making it to the ML, which indeed as Andrews stated is 80%, As we will see later when we go into smaller pivot scales this is a fantastic pivot combination fork!
It gives us our new normal trend direction on the new trend channel of the normal wave expected trading range. 3P’s Panic control.
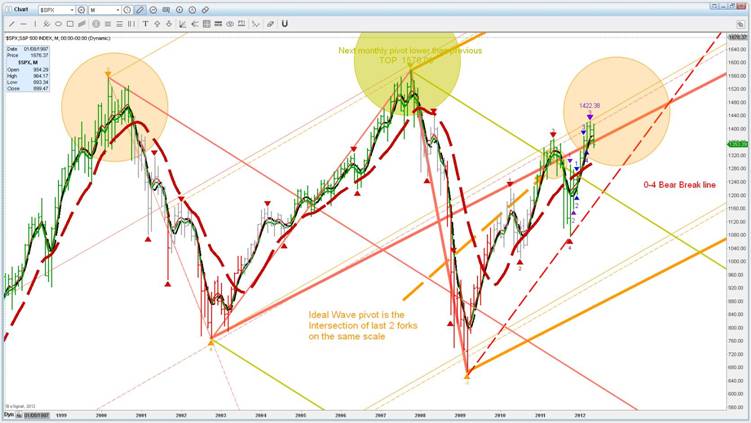
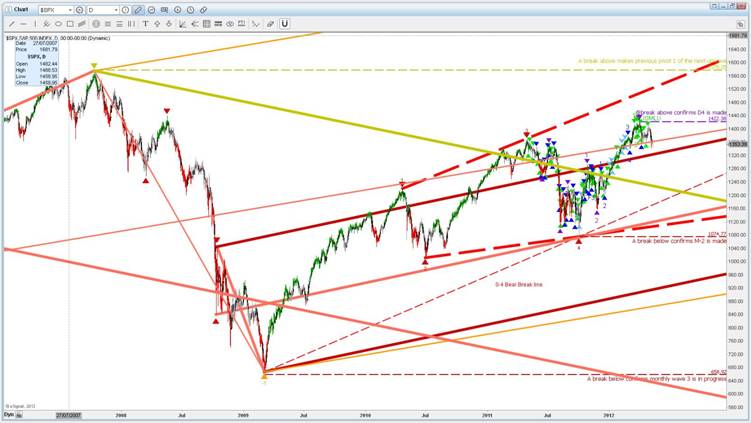
Price movement can be easily seen – the rapid drop to the 2009 low towards the ML, and the subsequent slower rise since to the MLU (Median Line Upper parallel) Also what is obvious is how much steeper weekly ( red pivot scale ) wave 3 is! All predictable under the 3P’s - Panic behavior. So we have a clear momentum indicator and the only one I have come across that is forward looking!
As prices reach the Median line or parallels we have a clear indication of price extremes – overbought and over sold conditions of which there are numerous indicators but none of which give you the information so clearly with definable probabilities and again projecting forward!
What also is very obvious if that just with what we have done so far well chosen trendlines – become useful support and resistance lines – the 234ML was a resistance line to the 2007 top. Its MLL was is a resistance line to the current weekly pivot 3 (which is near the intersection of the last W( Pivot scale – Monthly, Weekly, Daily, 4Hourly, Hourly) 345 fork, and as one scale down Daily pivot 3 has not made it past there is an extremely high probability that prices will not rise above this resistance line for many years to come – unless we change our behavior and break out of the 3P’s.
What is also clear is the head and shoulders pattern on the monthly pivot scale, and the bear flag (0-4 bear break line) which is derived by joining pivot 0 and 4 – This line is the most reliable trend change indicator on every pivot scale with the exception of wave failures (less than 20%). So for all the bears on a monthly pivot scale the technical are bullish with the exception of Elliot’s motive wave which has filled its criteria of a monthly pivot scale top as detailed below.
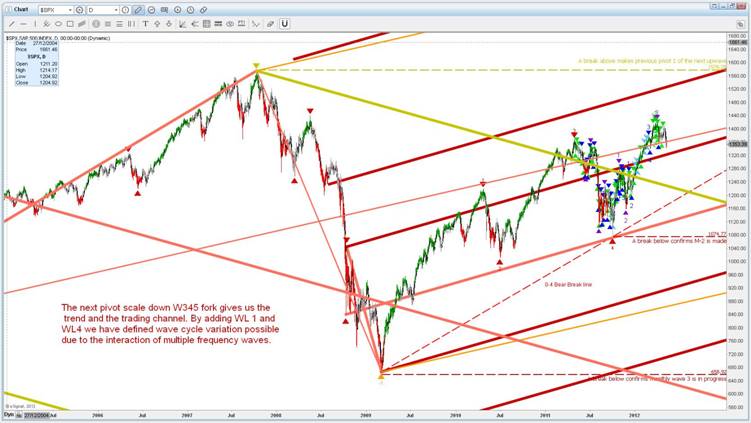
Now that we have the big picture we are going to move down a pivot scale to Weekly pivots for a clearer understanding of waves within waves and further pivot combinations that give us highly predictable potential pivot locations to show how critical pivot selection is if you want to derive tradable information so as in part 4 where I demonstrated how to apply basic trendlines be used with EW analysis I will use the same methodology but using simple forks, and will be looking from the 2009 low. We will be doing it on a daily pivot scale chart (you need to work in multiple pivot scales to find the appropriate correlations), I would not expect weekly correlations using quarterly bars, etc. Those shown in the table in Part 2 are the combinations I use.
Below I have shown the ideal expected pivot location, together with wave validation criteria, and the 0-4 break line (pivots 0 and -4 in a bear market for a bull break line). This needs to be done as part of your risk management on whatever pivot scale you are trading.
By now applying cycle forks we can start to see waves within waves, in this case weekly pivot scale (red) within the monthly pivots scale forks (gold and orange). Retrospectively we can see D1/W1 and D2/W1 (daily pivots 1 and 2 of weekly pivot 1) being made at the W345ML, and D3/W1 and D4/W1 being made on the W345MLU. Also obvious is the presence of subwaves in weekly waves 1, 2, 3, 4 and 5 and that wave 2 is simple compared to wave 4 resulting in an expanding pivot formation. Also what is clear is the support and resistance offered by the forks, and the concentration of pivots around the ideal wave target – or volatility! The same occurs on smaller time scales.
Now understanding that when waves interact at a point in time the resultant wave pivot can be anywhere between 0 and .2 times its frequency we use WL1 and WL4 to define our expected cycle trading range, and now we have defined our trading limits should we be trading on a weekly pivot scale!
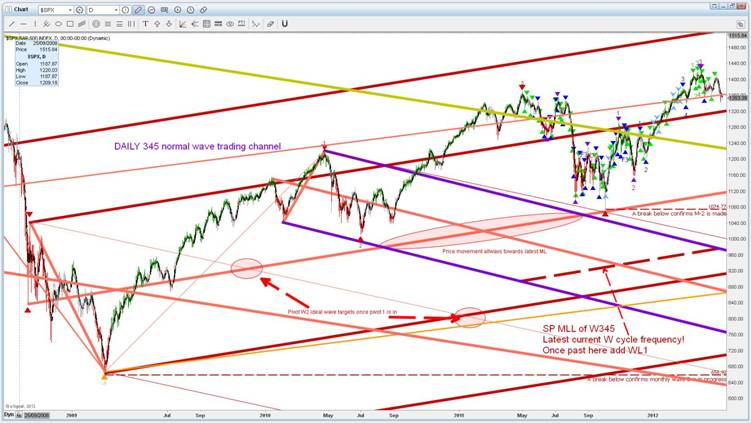
Retrospectively we can see that the MML (Monthly Median Line) has been made which Andrews said has a 80% probability – but be warned only if you know which pivots to use!!
Also we can see we would have had no need to panic as this wave off the 09 bottom has shown no unexpected price action within our probabilistically defined trading parameters trading weekly pivots 3P’s,
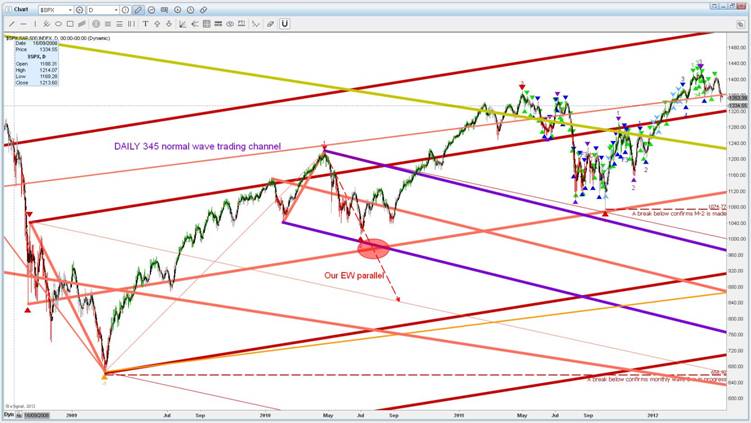
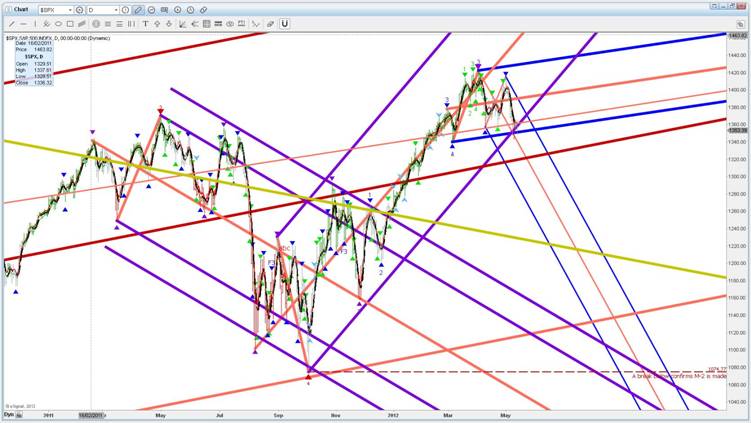
However just look at all those ups and downs we could have traded! So moving down to the daily pivot scale (purple) apply the same principles of multi pivot scale analysis. Once W1 is confirmed we draw W451. We also draw D345 to give us our new trading parameters – but on a daily pivot scalel. This greatly reduces our expected trading range as shown for W2 with its ideal and zoomed in parameters! (we will go through smaller pivots and more combinations and techniques as we look in more detail from last Octobers lows – you can then apply the methodology to whatever pivot scale you want). Basic wave theory tells us waves go from one extreme to the other so Had Andrews had out technology I would safely say he would have upped the probabilities to over 80%! Also shown is the SP of W345MLL – between our daily trend channel.
So prices will be moving to the latest ML as shown below, and we have clearly defined trading parameters to control our 3P’s. Also note we are now in our third wave level Monthly, Weekly and Daily! Waves within waves!!!
Also note the value of old support and resistance lines – Look at last Octobers lows! Good trend lines DO NOT come from random pivot selection!
This is a bit messy! What other information do we have? Our EW parallel which further reduces out trading parameters as shown below and greatly tidies our picture!
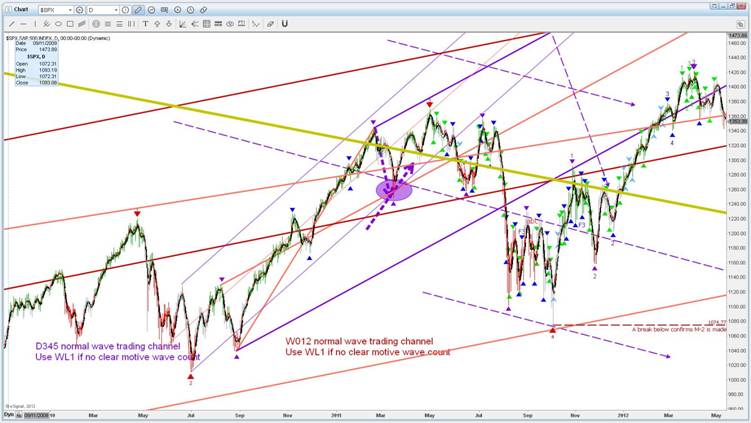
Once pivot 2 is confirmed we draw fork W012, update our D345, put in our EW and cycle fork parallels and SP’s. I know this looks messy and that is why I use colour coding! What is most important though is that you can see we have two trend forks – the W012 and new D345. Waves within waves! So we have highly probabilistic trading parameter so we can control our 3P’s and have managed risk and emotions!
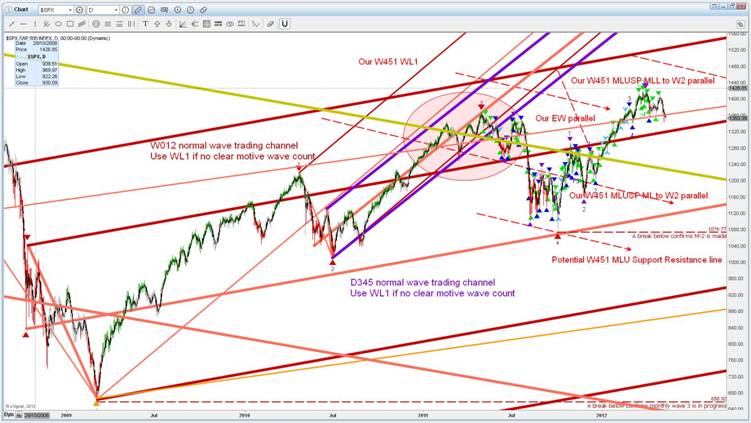
You will also notice a big ideal target area – we have a confluence of multi pivot scale support and resistance lines so highly probable to expect increased volatility as prices approach this area! Also you will notice pivot 2 was made below the D345MLL. This means it is highly probable to expect additional sub waves! Using the same methods explained so far on the next pivot scale down 4H, you would have been within 4H trading parameters despite it falling outside of the current D345 daily trend! Also you will if you look back at the previous chart note that D1 and D2 are made around the previous ML! Once D1 and D2 are in that allows us to draw D012. By drawing the EW cycle fork from D0 to D1 and sliding it to D2 gives us 2 ideal targets for pivot 3, with the intersection of D345 and D012 from which we draw 2 horizontal lines between where pivot 3 is expected as shown below. Again this is confusing so I will tidy it up in the following drawing. You will notice that this also is the intersection of D012 MLU and ML with D345MLU!
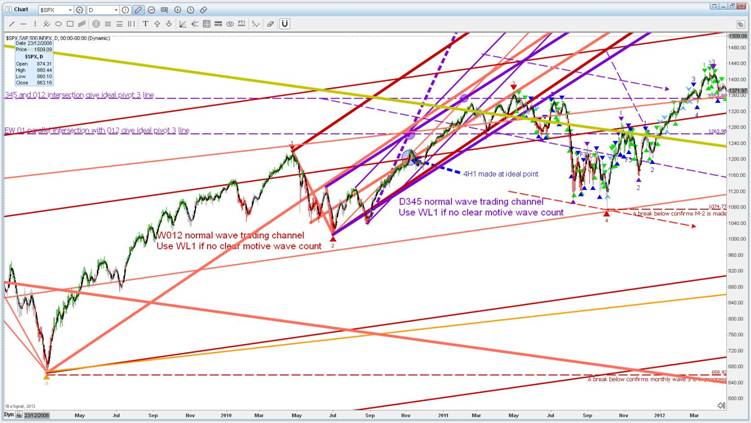
Simplified! By now you will have notice I actually use target lines, the reason is simple – waves move in 2 dimensions and I am working off the last unknown reaction points! I could draw a second target box for the alternative parameters but they are only required if there is a not a clear wave count.
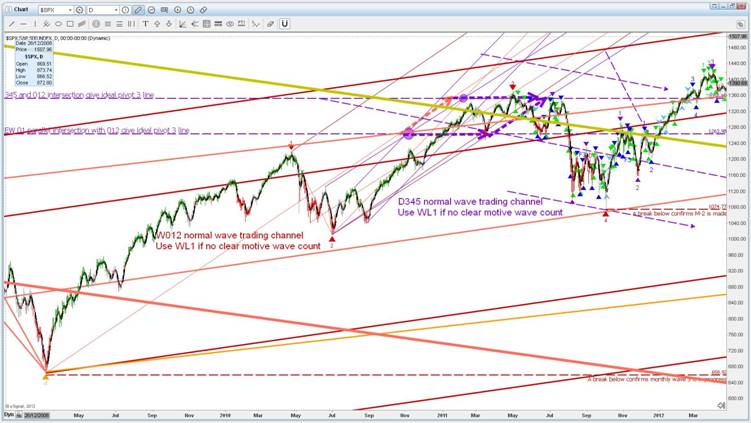
Do the same procedure on the 4H pivot scale and you will find the D3 falls within the specified limit defined. Once D3 is in draw your D123 fork and your wave 2 EW parallel. In addition add in you EW D13 parallel and move that to D2 and tidy it up to give the following target area for D4, and pivot falls within 1 day of its ideal intersection of D345ML and D123ML, but Also on the D0123SP MLH to D3, as well as the EW Parallel!
The normal wave ideal target for pivot 5 is the 345ML and 123MLU SPML to 3. Draw you EW parallels and look where the 4H123 MLU pivot 5 target line – its MLU – all within clearly defined trading parameters!
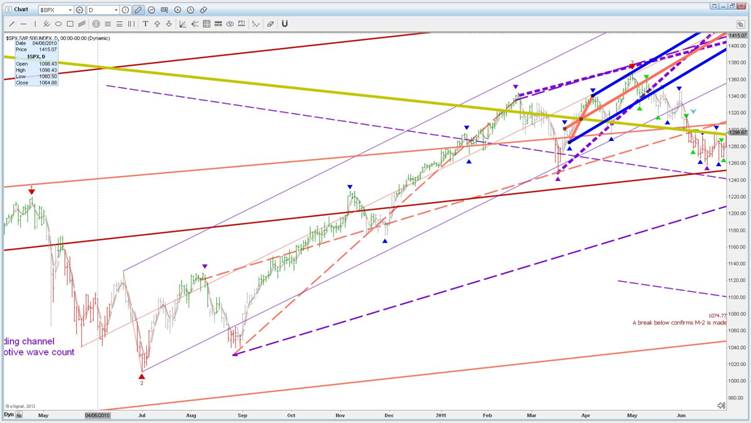
So was the subsequent price action unexpected or was it predictable based upon a different interpretation of research done over 100 years ago??? Remember waves within waves, within waves! Weekly pivot scale – red, daily pivot scale purple, 4H pivot scale blue! You decide! To me it looks very like the elephant is coming back into the room! We appear to be in wave 3 so where will it stop?
You may have noticed I have provided you with pure technical analysis without reference to any news or substantiation from any other source or influence – oh and it still works 100 years later! NOTHING HAS CHANGED and we still let our governments control the economy and money!
Any analyst that can demonstrate that through a systematical approach rather than random waffle and changing trend lines as the picture develops analysis, I will give permission to use any and all my IP and Copyrighted materials free of charge.
The concept is to reduce vulnerability by customers that are ignorant (NOT STUPID) in a highly specialized field , those with the knowledge and position have a social duty of care if we want society to improve for all, rather than those in control of power!
For more information of how I do what I do http://mapportunity.wordpress.com/ . Comments and discussions very welcome!
The statements, opinions and analyses presented in this site are provided as educational and general information only. Opinions, estimates, buy and sell signals, and probabilities expressed herein constitute the judgment of the author as of the date indicated and are subject to change without notice.
Nothing contained in this site is intended to be, nor shall it be construed as, investment advice, nor is it to be relied upon in making any investment or other decision.
Prior to making any investment decision, you are advised to consult with your broker, investment advisor or other appropriate tax or financial professional to determine the suitability of any investment.
© 2012 Copyright Marc Horn - All Rights Reserved Disclaimer: The above is a matter of opinion provided for general information purposes only and is not intended as investment advice. Information and analysis above are derived from sources and utilising methods believed to be reliable, but we cannot accept responsibility for any losses you may incur as a result of this analysis. Individuals should consult with their personal financial advisors.
© 2005-2022 http://www.MarketOracle.co.uk - The Market Oracle is a FREE Daily Financial Markets Analysis & Forecasting online publication.