


Gold Bottom is In, But is it September 2008 or October 2008?
Commodities / Gold and Silver 2012 May 19, 2012 - 11:51 AM GMTBy: Jordan_Roy_Byrne

 We began the week by making a ballsy prediction about the precious metals complex. We believed a major bottom could happen this week. In the wake of the European debt crisis and potential "credit events," the precious metals became extremely oversold based on a number of metrics. Technically, we saw that Gold and Silver were nearing the December lows which produced a good rally. The gold stocks were nearing the 50% retracement of their 2008-2011 bull move. The combination of an extreme oversold condition and technical support usually produces bottoms. It wasn't a difficult call but putting it on paper was. With the low in, the question now becomes, is this an interim bottom or will it be the major low we initially expected?
In this piece we are going to look at the equities because they lead the metals at key turning points. This was the case in 2007-2008, the end of 2008 and most recently, in 2011. Predictably, the mining equities will lead the next rebound.
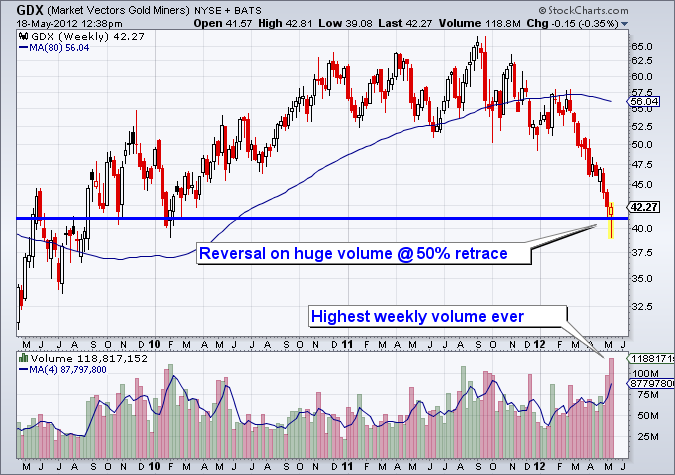
Below we show a weekly chart of GDX. GDX was down 9 of the last 11 weeks and until yesterday, 10 of the last 12. The market has formed a very bullish reversal candlestick at the 50% retracement and on the highest weekly volume.
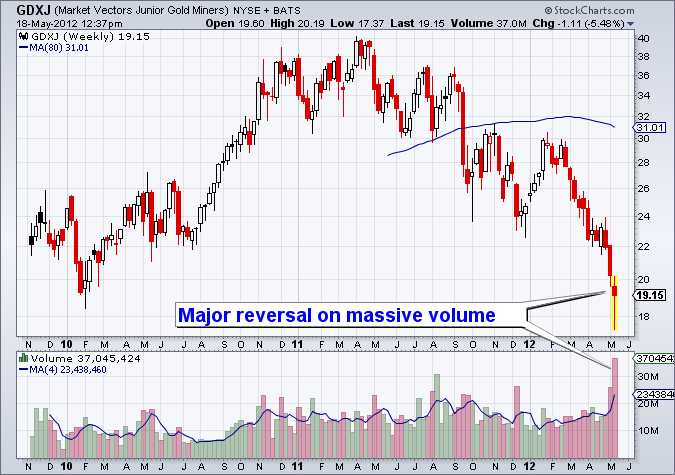
Next we show GDXJ, the "juniors" though it is comprised of mid-tier producers and larger explorers and developers. GDXJ has declined in 13 of the past 16 weeks. The market plunged at the start of the week but has now reversed most of the losses. The volume has been massive this week. Look at the tail on that candlestick!
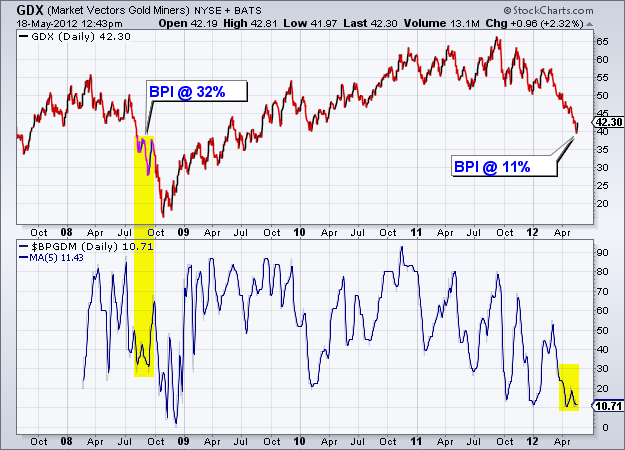
Ok Jordan, those charts are great and all, but how do they compare to 2008? First, let's compare the breadth which is a fancy word for how much of the sector is going up or down. One breadth indicator anyone can use is the bullish percent index (bpi) which shows the percentage of stocks on a Point & Figure buy signal.
In the chart below we compare 2008 and 2012 using the BPI. During the initial respite in August and September of 2008, the BPI (using a 5-day moving average) bottomed at 32%. Presently, the BPI is at 11%. At the ultimate low in 2008, the BPI was at 5%.
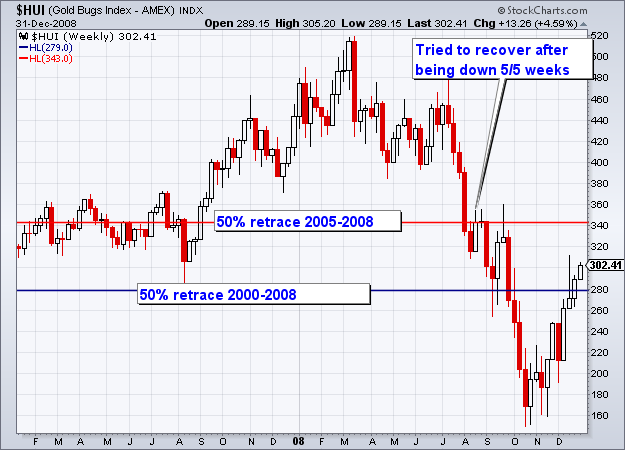
Next I want to compare the current price action to the price action in 2008. Presently, the gold stocks put in a great weekly reversal, at the 50% retracement after declining in nine of the past 11 weeks. In the summer of 2008, the gold stocks attempted to rally after declining for five straight weeks. The HUI formed a bullish hammer at the 50% retracement (2000-2008) after declining in seven of the past eight weeks (with one week being a push).
Judging from the technicals and recent sentiment data (presented in our Monday editorial), it is clear that the gold stocks are currently more oversold and much closer to a major bottom relative to the failed recovery in the summer of 2008. Breadth is far more oversold and the market has been in decline for several more weeks. Moreover, in our previous update we noted how sentiment indicators were nearing October 2008 levels. On Wednesday, the daily sentiment index for Gold reached 5% bulls. Assets in the Rydex Fund, which were $350 Million at one point, fell in three days from $103 Million to $91 Million.
We can form a conclusion based on the technicals and sentiment but developing events can can have an unforeseen and unpredictable impact. There are two fundamental forces that will impact the charts. First, we need to consider the ongoing turmoil in Europe and how and when it could negatively impact the market. Second, we have to juxtapose that with the inevitable monetary response which will be very bullish for Gold and gold shares. At the same time, we need to weigh those events with the market's response. Currently, the gold shares have begun a predictable rebound, and this rebound will go a long way in confirming or not confirming our previous prediction
If you'd like professional guidance in this endeavour then we invite you to learn more about our premium service.
Good Luck!
Jordan Roy-Byrne, CMT
Trendsman@Trendsman.com
Subscription Service
Trendsman” is an affiliate member of the Market Technicians Association (MTA) and is enrolled in their CMT Program, which certifies professionals in the field of technical analysis. He will be taking the final exam in Spring 07. Trendsman focuses on technical analysis but analyzes fundamentals and investor psychology in tandem with the charts. He credits his success to an immense love of the markets and an insatiable thirst for knowledge and profits.
© 2005-2022 http://www.MarketOracle.co.uk - The Market Oracle is a FREE Daily Financial Markets Analysis & Forecasting online publication.