


Stock Market Downtrend May Have Bottomed
Stock-Markets / Stock Markets 2012 May 26, 2012 - 11:22 AM GMTBy: Tony_Caldaro

 Markets rebounded this week after last week’s nasty selloff. Last week’s decline of SPX/DOW 3.9% was the largest weekly decline in six months. The previous one was the week of November 21, 2011: a 4.75% decline that marked the end of Major wave 2. Thus far, it looks like the recent selloff may have marked the end of Major wave 4. For the week the SPX/DOW were +1.20%, and the NDX/NAZ were +2.05%. Asian markets were flat, European markets were +0.6%, and the DJ World index gained 0.7%. On the economic front it was a mixed week. All five the publicly watched indicators were higher: existing/new home sales, FHFA housing prices, durable goods orders and consumer sentiment. Yet, four of the not so publicly watched indicators we track were all lower: the M1- multiplier, new home sale prices, the monetary base and the WLEI. The last week of May starts off with a US holiday, then is followed by a slew of economic reports. Q1 GDP, the Payrolls report and PCE prices highlight the week. Best to your week!
LONG TERM: bull market
While we entertained some alternates counts for the medium term last week. None of them suggested this Mar 2009 bull market was over. Even though the market hit a level which was about 2% lower than expected. It did hit a medium term oversold level that has only occurred once in each of the past four years. Each time this has occurred, the market has rallied about 100 SPX points within two weeks. Currently the market has only risen 36 points, 1292-1328, with a week to go. If this pattern prevails this week could be quite interesting.
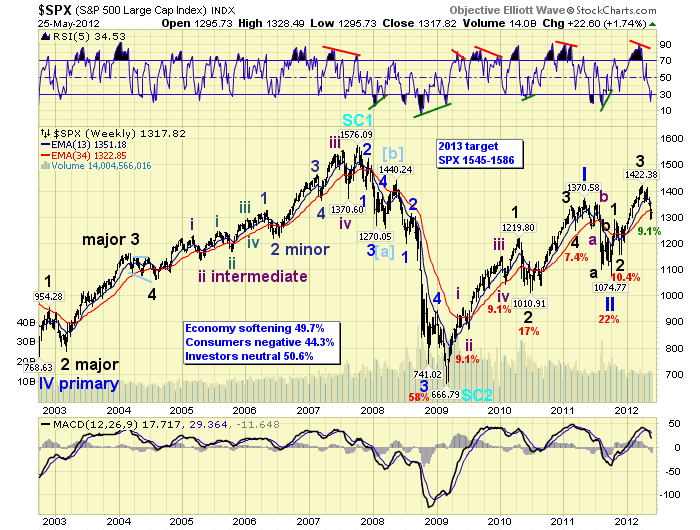
Since the world’s markets are linked these days, and our OEW analysis covers twenty world indices. We thought it would be best to give a quick overview, by region, and alert everyone to the negative long term prospects in the majority of these indices. In Asia we track eight countries. Six remain in long term downtrends, and our smart money indicator has seven of these markets with negative outflows. The only real positive is Indonesia. In Europe we track seven indices. Six remain in long term downtrends as well, and five have negative outflows. The only real positive is England. Of the five that are left: the DJ World index, Brazil, Canada, Russia and the US. Four remain in long term uptrends, but three (the commodity indices) have negative outflows. The real positives here are the US, and oddly enough the DJ World index. With only 35% of the world’s market in long term uptrends, it will be a difficult task for these bull markets to make much more upside progress. Unless, of course, world markets change dramatically. Our bull market target remains SPX 1545-1586.
MEDIUM TERM: downtrend may have bottomed
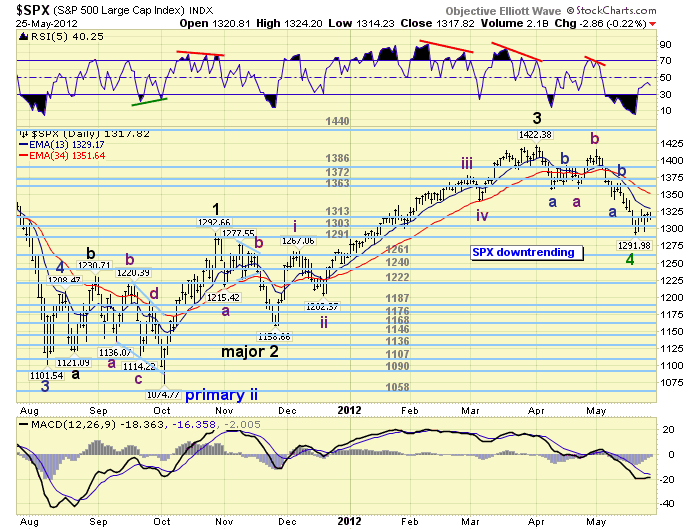
Last weekend we noted the six corrections during this bull market have ranged from 7.4% to 22.0%, with 9.1% being hit twice. A week ago friday the SPX hit 1292, a decline from 1422 and exactly 9.1%. The decline in the SPX appears to have taken the form of a double three: a failed flat ending at 1359, a B wave to 1415, then a zigzag to 1292. Note the zigzag (1415-1292) equalled twice the length of the flat (1422-1359). During Major wave 2, a zigzag, wave C (1278-1159) equalled 1.5 times wave A (1293-1215). So we have alternation between the waves. Also note Major wave 2 declined 134 points (1293-1159), while Major wave 4 has declined 130 points (1422-1292). Symmetry. And, SPX 1292 represents a 50% retracement of the entire Major wave 3 uptrend from SPX 1159-1422. The market harmonics appear to point to SPX 1292 as a significant low.
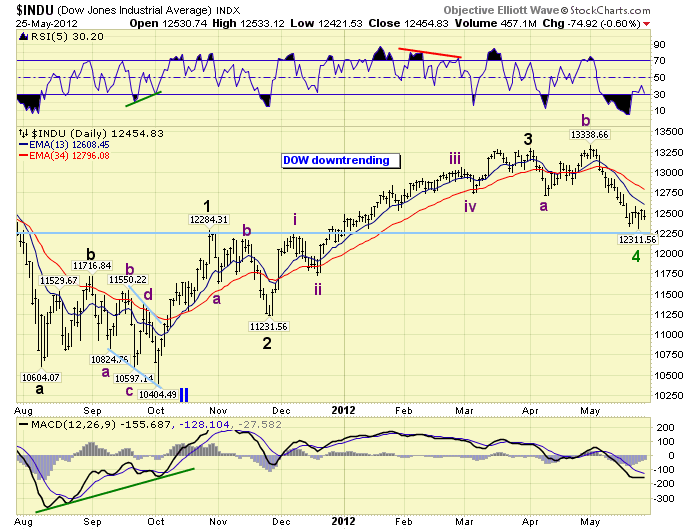
The DOW, however, has taken on a different pattern. A five wave downtrend from 13,300 to 12,700, a three wave uptrend to 13,300, then another five wave downtrend to 12,300. This looks more like an irregular zigzag, with wave C equalling 1.618 times wave A. This wave activity also allows for a potential alternate count which was posted in last week’s weekend update. For now, we remain with the primary counts posted on the SPX and DOW.
SHORT TERM
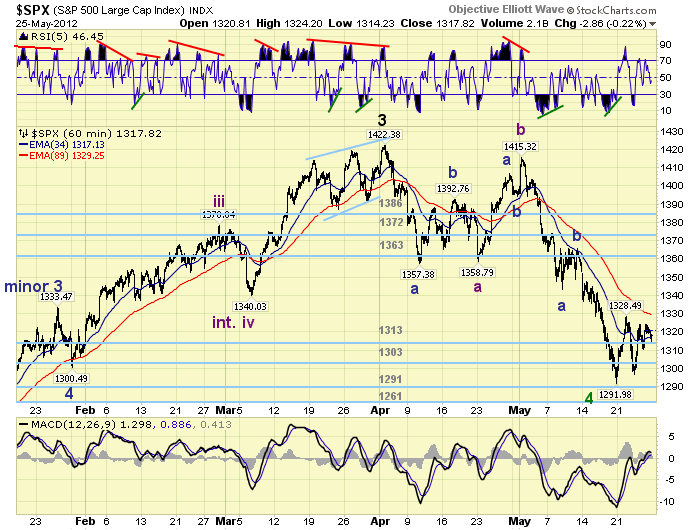
Support for the SPX remains at the 1313 and 1303 pivots. Resistance is at the 1363 and 1372 pivots. Short term momentum ended the week right around neutral. The short term OEW charts signalled a potential positive swing on friday when the SPX traded above 1321. This is the first potential reversal since the C wave SPX 1415 decline began. As a result we labeled the recent low with a tentative green Major wave 4.
While the correction was unfolding between April and May. The DOW made a new intraday high for one day on May 1st, while the other three major indices did not. This signalled the end of its uptrend, and all four major indices then declined in unison. Last wednesday the DOW made a new, one day, intraday low for its downtrend while the other three major indices did not. This in reverse may have signalled the end of the downtrend and correction. Note after the high in May the markets moved very little for the first two days and then accelerated to the downside. After wednesday’s low the markets again moved very little for the next two days into friday’s close.
Short term support is at the OEW 1313 and 1303 pivots, with resistance at SPX 1324/28 and 1342/47. If our short and medium term count is underway the SPX should hold the OEW 1313 pivot range (1306-1320) during any further pullbacks. The SPX closed at 1318 on friday. Best to your trading and extended weekend!
FOREIGN MARKETS
The Asian markets were quite mixed on the week and ended flat. Only China is in an uptrend.
The European markets were mostly higher gaining 0.6% on the week. All indices in downtrends.
The Commodity equity group was also mixed on the week for a net gain of 0.5%. All downtrends here as well.
The downtrending DJ World index gained 0.7% on the week.
COMMODITIES
Bonds continue to uptrend but were flat on the week. The 10 yr yield is 1.75%.
Crude made a new low for its downtrend at $89.28 and has now corrected 19% from its early March $110.55 high. It declined 0.8% for the week. We are now observing a positive divergence on the daily chart, with the most extreme oversold condition since 2008 on the weekly chart.
Gold has remained in a downtrend for three months and lost 1.1% on the week. The most obvious count, since the $1924 high, is a contracting Major wave 4 triangle. This would also fit into the Silver long term count. A rally above $1675 should turn both metals positive again.
The USD continues to uptrend gaining 1.4% on the week. It is starting to display a negative divergence at extremely overbought levels. Should it start to weaken here its uptrend is likely over.
NEXT WEEK
Monday is a holiday. Tuesday we have Case-Shiller at 9:00, and Consumer confidence at 10:00. On wednesday Pending home sales. Thursday, Q1 GDP (estimate 1.9%), weekly Jobless claims, ADP and the Chicago PMI. On friday the monthly Payrolls report, Personal income/spending, PCE prices, ISM manufacturing, Construction spending, and monthly Auto sales. The FED has nothing scheduled for the week. Best to your week!
CHARTS: http://stockcharts.com/...
http://caldaroew.spaces.live.com
After about 40 years of investing in the markets one learns that the markets are constantly changing, not only in price, but in what drives the markets. In the 1960s, the Nifty Fifty were the leaders of the stock market. In the 1970s, stock selection using Technical Analysis was important, as the market stayed with a trading range for the entire decade. In the 1980s, the market finally broke out of it doldrums, as the DOW broke through 1100 in 1982, and launched the greatest bull market on record.
Sharing is an important aspect of a life. Over 100 people have joined our group, from all walks of life, covering twenty three countries across the globe. It's been the most fun I have ever had in the market. Sharing uncommon knowledge, with investors. In hope of aiding them in finding their financial independence.
Copyright © 2012 Tony Caldaro - All Rights Reserved Disclaimer: The above is a matter of opinion provided for general information purposes only and is not intended as investment advice. Information and analysis above are derived from sources and utilising methods believed to be reliable, but we cannot accept responsibility for any losses you may incur as a result of this analysis. Individuals should consult with their personal financial advisors.
© 2005-2022 http://www.MarketOracle.co.uk - The Market Oracle is a FREE Daily Financial Markets Analysis & Forecasting online publication.