


Major Improvement in Gold's Interim Outlook
Commodities / Gold and Silver 2012 Jun 04, 2012 - 01:01 AM GMTBy: Clif_Droke

 As of the end of May 2012, gold suffered the indignity of its first "bearish" year after its long-term bull market began in 2001. Gold made almost no net progress in the past year, and although the gold price is still well above its long-term uptrend, on an intermediate-term basis it's hovering only slightly above its year-ago level. There are reasons for believing that in the coming weeks, however, gold's intermediate-term fortunes will change for the better.
Gold's lack of progress through the month of May was thanks largely to a series of margin requirement increases by CME Group last summer. This policy move on the part of the commodity market regulators took the air out of gold's speculative balloon and chased away the momentum crowd, resulting in a lower gold price and a lack of "hot money" trading interesting in the yellow metal. When the gold market lost its status as a leveraged play, the momentum-chasing hedge fund crowd quickly left and went off in search of faster-moving markets. That left the yellow metal firmly in the hands of the die-hard long-term investors.
While the lack of participation by the momentum crowd can be viewed as a positive in terms of reducing gold's relative volatility, it hasn't exactly been a boon to intermediate-term swing traders who count on having an extended upward trend to ride.
Since the beginning of May, gold has been plagued by the uncertainty arising from renewed fears over the euro-zone debt crisis. Investors largely shunned the metal in favor the U.S. dollar.
The first day of June witnessed a watershed event for gold from a technical standpoint, however. An important indicator of gold's internal condition has registered a very positive reading - the first such reading in years. As we mentioned in our previous commentary, the 10-month price oscillator for gold, which measures how "overbought" or "oversold" the gold price is, registered its first "oversold" reading since the bottom of the credit crisis in late 2008. See chart below.
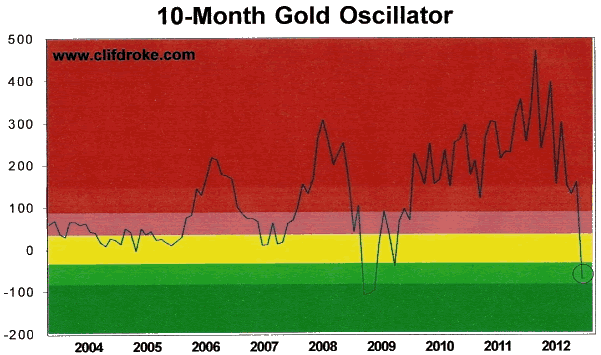
This is a significant event considering that gold has been technically "overbought" on a longer-term basis for the last few years according to the oscillator. The switch from an overbought to an oversold reading is a positive event for gold and will pave the way for new purchases for intermediate-to-longer-term investors in the coming weeks and months.
Mining Stocks
The broad market correction that began in April has been less kind to commodities than it has to stocks. From the standpoint of the U.S. consumer, however, this is a good thing. Oil and gasoline prices have dramatically declined in recent weeks which will help lower the consumer price level somewhat in the coming weeks and months. This in turn will bode well for the domestic retail recovery (see U.S. Economy section below).
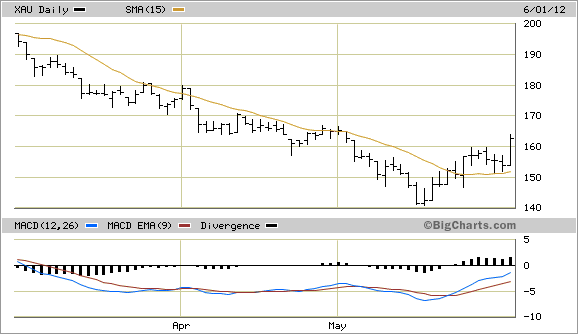
The big drop in commodity prices may also present bargains for value investors in the coming weeks. One area that is of particular interest is precious metals and mining stocks. Gold mining stocks in particular are beginning to look attractive at current levels. Below is the daily chart of the XAU Gold Silver Index in relation to its 15-day moving average. The XAU technically confirmed an immediate-term bottom signal last Friday per the rules of our trading discipline. One week later on June 1, the XAU broke out from its short-term trading range and advanced nearly 6% in a single day.
What's even more interesting from a technical perspective is that while the gold stocks had the weakest internal momentum reading of any of the major sectors in April and May, the internal momentum readings are now improving. As of June 1, the gold stock group actually has the best internal momentum readings on a relative basis than almost any other major sector right now.
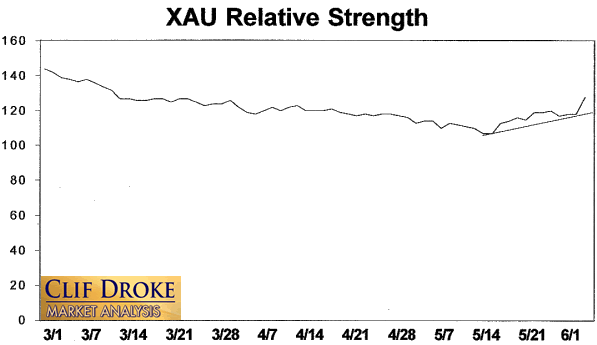
Consider also that the relative strength line for the XAU Gold Silver Index, which compares sector strength against the S&P 500, has recovered its previous levels from late March through April. The XAU index itself hasn't yet made this recovery, but the relative strength line suggests it might just recovery its March high in the coming weeks.
In light of this marked technical improvement, traders might wish to take a closer look at the actively traded gold stocks. It's often true that in the wake of a major market correction the biggest percentage decliners are often the biggest percentage gainers once a new up cycle begins (and vice versa). If the gold stock internal momentum indicators continue improving in the coming days, this will likely be the case for the gold stocks in the early stages of the new interim cycle scheduled to begin in June.
U.S. Economy
Friday's broad market sell-off was blamed by the media on a negative jobs report with the implication that the economic recovery is slowing. Our New Economy Index (NEI) tells a much different story, however, as the following graph shows.
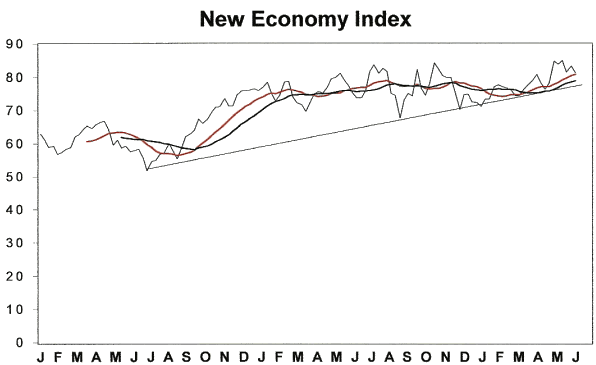
The New Economy Index (NEI), which measures the state of the U.S. retail economy, has been in a rising trend since 2009 and hasn't given a "sell" signal since 2010 in what was only a temporary blip in the economic recovery. Since then the NEI has been in a bullish trend for the U.S. retail economy despite the negative headline data at home and abroad at various times in the last couple of years.
NEI is essentially a composite of the leading retail stocks which are used to reflect the combined outlook for retail employment, transportation, small and mid-sized business and consumer retail sales. When the NEI price line is in a rising trend the domestic economy is in decent shape. Conversely, a falling NEI reflects a poor retail economy. The 12-week (black line) and 20-week (red line) moving averages are further used to confirm strength or weakness within the economy.
The latest NEI reading was updated as of Friday, June 1. As the chart shows, the NEI is still above its rising intermediate-term trend line which tells us that the U.S. retail economy is still in a fairly good condition. With the 4-year cycle still up until October - and with this being an election year - the retail economy is likely to continue to see improvement this summer and into the election. There is simply too much at stake here for the "powers that be" to let the U.S. economy fail at this time, which is why I'm more inclined to believe the positive reading in the NEI than the recent negative reports released by the Labor Department.
2014: America's Date With Destiny
Take a journey into the future with me as we discover what the future may unfold in the fateful period leading up to - and following - the 120-year cycle bottom in late 2014.
Picking up where I left off in my previous work, The Stock Market Cycles, I expand on the Kress cycle narrative and explain how the 120-year Mega cycle influences the market, the economy and other aspects of American life and culture. My latest book, 2014: America's Date With Destiny, examines the most vital issues facing America and the global economy in the 2-3 years ahead.
The new book explains that the credit crisis of 2008 was merely the prelude in an intensifying global credit storm. If the basis for my prediction continue true to form - namely the long-term Kress cycles - the worst part of the crisis lies ahead in the years 2013-2014. The book is now available for sale at: http://www.clifdroke.com/books/destiny.html
By Clif Droke
www.clifdroke.com
Clif Droke is the editor of the daily Gold & Silver Stock Report. Published daily since 2002, the report provides forecasts and analysis of the leading gold, silver, uranium and energy stocks from a short-term technical standpoint. He is also the author of numerous books, including 'How to Read Chart Patterns for Greater Profits.' For more information visit www.clifdroke.com
© 2005-2022 http://www.MarketOracle.co.uk - The Market Oracle is a FREE Daily Financial Markets Analysis & Forecasting online publication.