


Five Dividend Paying Tech Stocks for Investing 2012
Companies / Dividends Jun 09, 2012 - 04:24 AM GMTBy: Fast_Graphs

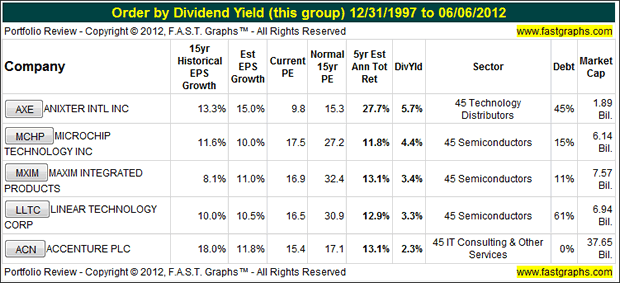
 Here are five technology-oriented companies that are currently trading at a price earnings ratio that implies that the stocks are attractively valued. Each of these five companies currently offers a dividend yield that is above-average as represented by the S&P 500.
The following table summarizes five technology-oriented companies that appear to be attractively valued, and lists them in order of dividend yield highest to lowest. From left to right, the table shows the company's stock symbol and name. Next the company's historical EPS growth followed by the estimated EPS growth. Next you will find the current PE ratio followed by the historical normal PE ratio for perspective. Then the 5-year estimated annual total return, followed by dividend yield for each company. The final three columns show the company sector, debt, and its market cap.
A Closer Look at the Past and the Future Potential
Since a picture is worth 1,000 words, we'll take a closer look at the past performance and future potential of each of our five candidates through the lens of F.A.S.T. Graphs™.
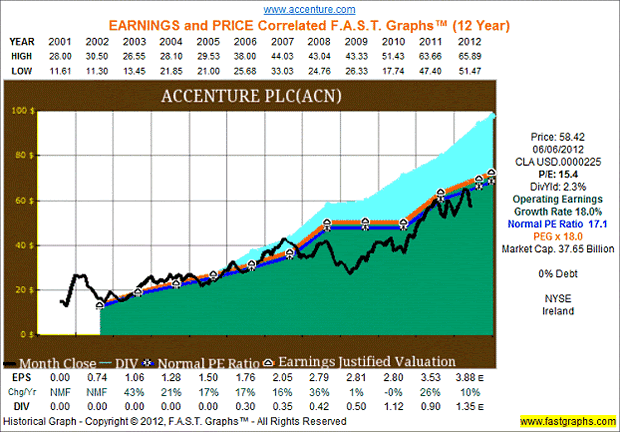
Earnings Determine Market Price: The following earnings and price correlated historical graphs clearly illustrates the importance of earnings. The Earnings Growth Rate Line or True Worth™ Line (orange line with white triangles) is correlated with the historical stock price line. On graph after graph the lines will move in tandem. If the stock price strays away from the earnings line (over or under), inevitably it will come back to earnings. The historical normal PE ratio line (dark blue line with*) depicts a PE ratio that the market has historically applied.
The orange True Worth™ line and the blue normal PE ratio line provide perspectives on valuation. The orange line reflects the fair value of each company's earnings relative to its growth rate achievement, and the blue line reflects how the market has traditionally valued the company's stock relative to its fair value. The blue line represents a trimmed historical normal PE ratio (the highest and lowest PEs are trimmed). These lines should be viewed as barometers or aids for ascertaining sound buy, sell or hold decisions. Rather than seen as absolutes, they should be seen as guides to better thinking.
About Anixter Intl Inc (AXE): Directly from their website
"Anixter International is a leading global distributor of communication and security products, electrical and electronic wire & cable, fasteners and other small parts. The company adds value to the distribution process by providing its customers access to 1) innovative inventory management programs, 2) more than 450,000 products and over $1 billion in inventory, 3) approximately 225 warehouses with 7 million square feet of space, and 4) locations in over 260 cities in more than 50 countries. Founded in 1957 and headquartered near Chicago, Anixter trades on the New York Stock Exchange under the symbol AXE."
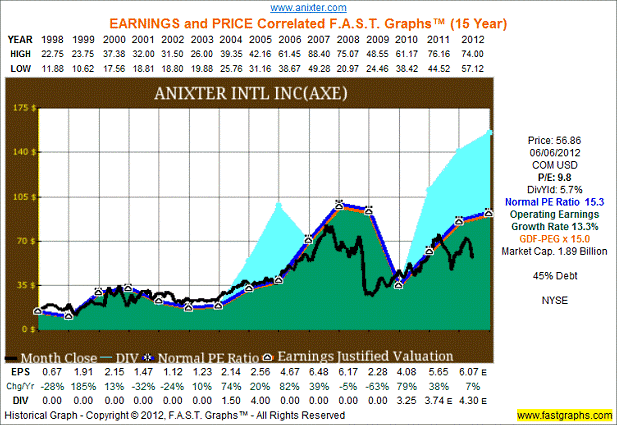
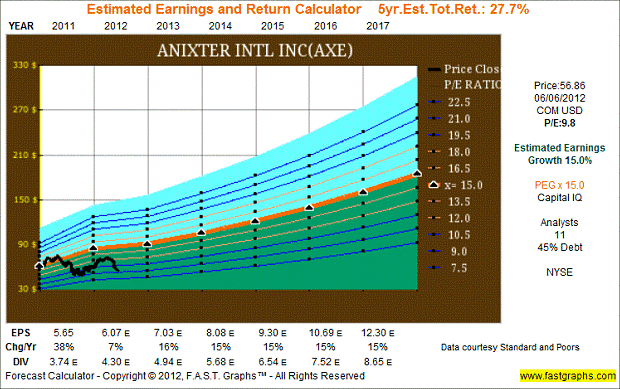
The consensus of 11 leading analysts reporting to Capital IQ forecast Anixter Intl Inc's long-term earnings growth at 15%. Anixter Intl Inc has medium long-term debt at 45% of capital. Anixter Intl Inc is currently trading at a P/E of 9.8, which is below the value corridor (defined by the five orange lines) of a maximum P/E of 18. If the earnings materialize as forecast, Anixter Intl Inc's True Worth™ valuation would be $184.43 at the end of 2017, which would be a 27.7% annual rate of return from the current price.
About Microchip Technology Inc (MCHP): Directly from their website
"Microchip Technology Inc. (NASDAQ: MCHP) is a leading provider of microcontroller, analog and Flash-IP solutions, providing low-risk product development, lower total system cost and faster time to market for thousands of diverse customer applications worldwide. Headquartered in Chandler, Arizona, Microchip offers outstanding technical support along with dependable delivery and quality."
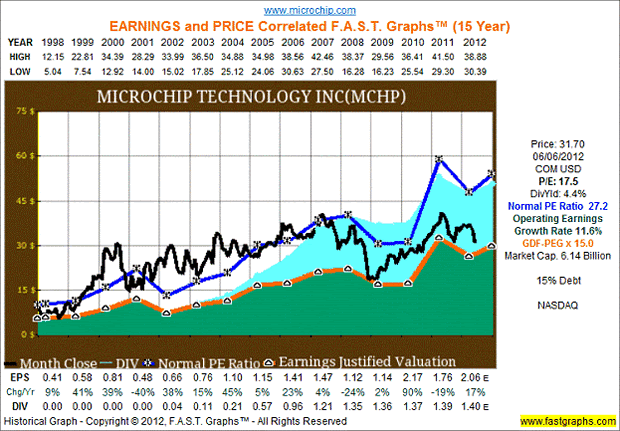
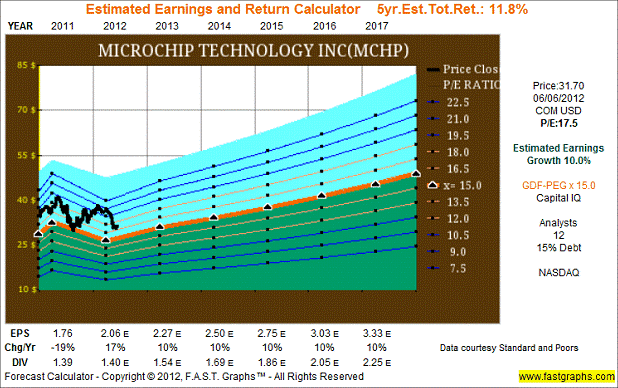
The consensus of 12 leading analysts reporting to Capital IQ forecast Microchip Technology Inc's long-term earnings growth at 10%. Microchip Technology Inc has low long-term debt at 15% of capital. Microchip Technology Inc is currently trading at a P/E of 17.5, which is inside the value corridor (defined by the five orange lines) of a maximum P/E of 18. If the earnings materialize as forecast, Microchip Technology Inc's True Worth™ valuation would be $49.96 at the end of 2017, which would be a 11.8% annual rate of return from the current price.
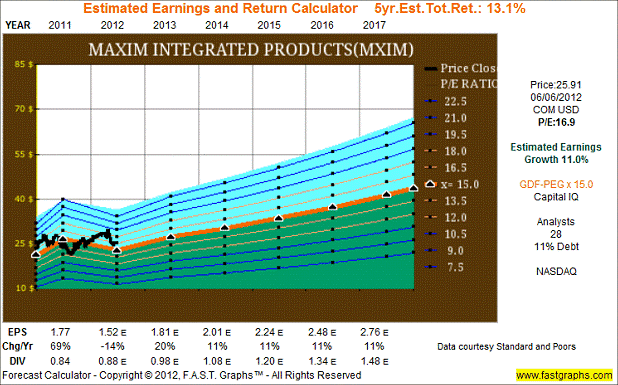
About Maxim Integrated Products (MXIM): Directly from their website
"Maxim makes highly integrated analog and mixed-signal semiconductors. Maxim reported revenue of approximately $2.5 billion for fiscal 2011."
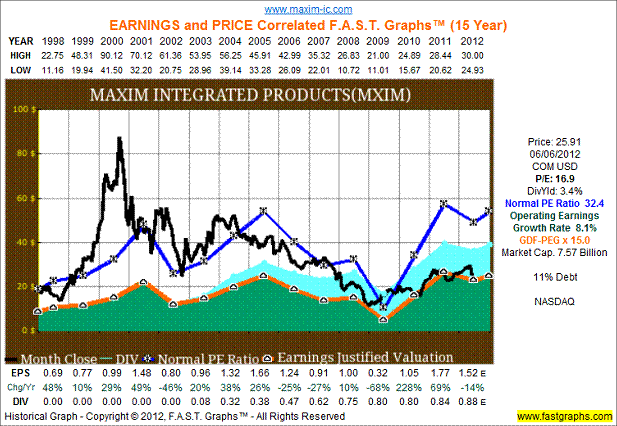
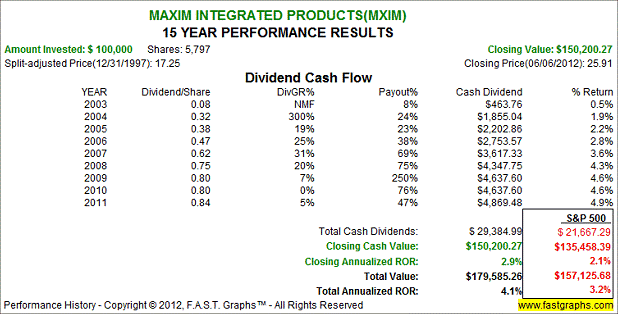
The consensus of 28 leading analysts reporting to Capital IQ forecast Maxim Integrated Products' long-term earnings growth at 11%. Maxim Integrated Products has low long-term debt at 11% of capital. Maxim Integrated Products is currently trading at a P/E of 16.9, which is inside the value corridor (defined by the five orange lines) of a maximum P/E of 18. If the earnings materialize as forecast, Maxim Integrated Products' True Worth™ valuation would be $41.33 at the end of 2017, which would be a 13.1% annual rate of return from the current price.
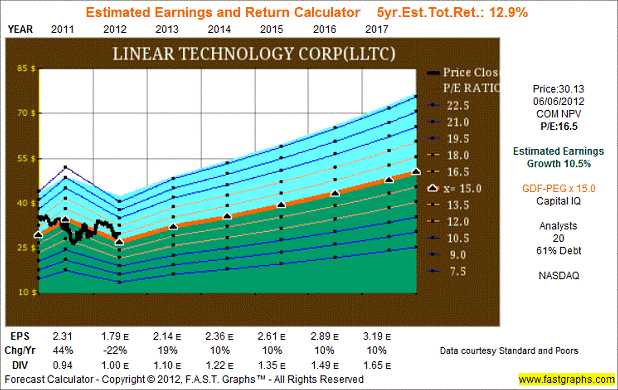
About Linear Technology Corp (LLTC): Directlyfrom their website
"Linear Technology Corporation, a member of the S&P 500, has been designing, manufacturing and marketing a broad line of high performance analog integrated circuits for major companies worldwide for three decades. The Company's products provide an essential bridge between our analog world and the digital electronics in communications, networking, industrial, automotive, computer, medical, instrumentation, consumer, and military and aerospace systems. Linear Technology produces power management, data conversion, signal conditioning, RF and interface ICs, μModule®subsystems, and wireless sensor network products."
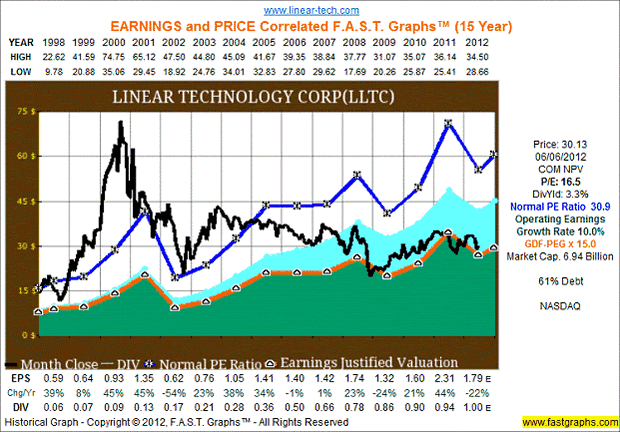
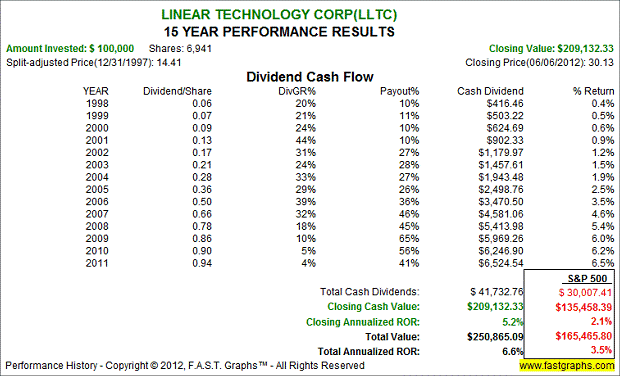
The consensus of 20 leading analysts reporting to Capital IQ forecast Linear Technology Corp's long-term earnings growth at 10.5%. Linear Technology Corp has high long-term debt at 61% of capital. Linear Technology Corp is currently trading at a P/E of 16.5, which is inside the value corridor (defined by the five orange lines) of a maximum P/E of 18. If the earnings materialize as forecast, Linear Technology Corp's True Worth™ valuation would be $47.86 at the end of 2017, which would be a 12.9% annual rate of return from the current price.
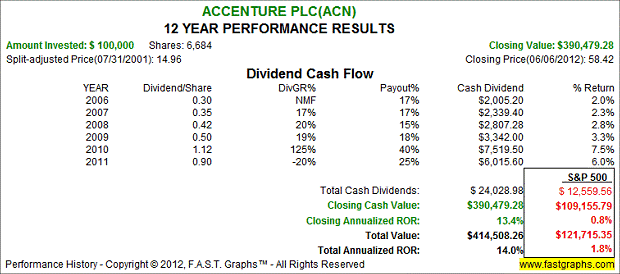
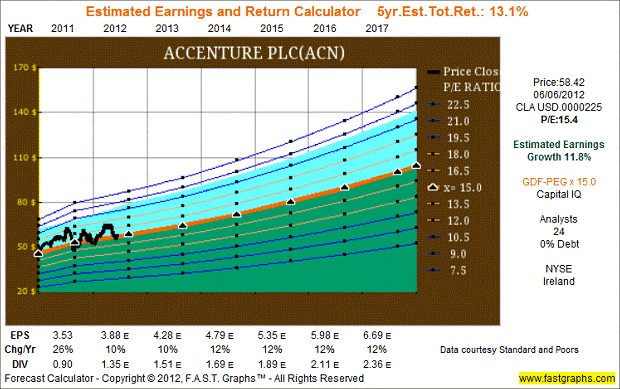
About Accenture (ACN): Directly from their website
"Accenture is a global management consulting, technology services and outsourcing company, with more than 246,000 people serving clients in more than 120 countries. Combining unparalleled experience, comprehensive capabilities across all industries and business functions, and extensive research on the world's most successful companies, Accenture collaborates with clients to help them become high-performance businesses and governments. The company generated net revenues of US$25.5 billion for the fiscal year ended Aug. 31, 2011."
The consensus of 24 leading analysts reporting to Capital IQ forecast Accenture's long-term earnings growth at 11.8%. Accenture has no debt. Accenture is currently trading at a P/E of 15.4, which is inside the value corridor (defined by the five orange lines) of a maximum P/E of 18. If the earnings materialize as forecast, Accenture's True Worth™ valuation would be $100.30 at the end of 2017, which would be a 13.1% annual rate of return from the current price.
Summary and Conclusions
We believe these tech stocks appear to look like they are at a valuation which warrants further research. By quickly reviewing these companies through the lens of the FAST Graphs tool, the investor interested in dividend growth might want to consider adding an investment in the technology sector for an added benefit of growth.
Three out of five of these stocks have been overvalued and are moving into the range of valuation. Two of the stocks have been good investments and look to be slightly undervalued today. As always, we recommend you conduct your own thorough due diligence.
Disclosure: Long MCHP and ACN at the time of writing.
By Fast Graphs
Disclaimer: The opinions in this document are for informational and educational purposes only and should not be construed as a recommendation to buy or sell the stocks mentioned or to solicit transactions or clients. Past performance of the companies discussed may not continue and the companies may not achieve the earnings growth as predicted. The information in this document is believed to be accurate, but under no circumstances should a person act upon the information contained within. We do not recommend that anyone act upon any investment information without first consulting an investment advisor as to the suitability of such investments for his specific situation.
© 2005-2022 http://www.MarketOracle.co.uk - The Market Oracle is a FREE Daily Financial Markets Analysis & Forecasting online publication.