


Stock Market Bearish Monthly RSI Divergence 100% Accuracy Rate; Occurred at 91.6% of Market Tops
Stock-Markets / Stocks Bear Market Jun 10, 2012 - 11:29 AM GMTBy: Steven_Vincent

 Relative Strength Index is one of the most widely recognized and followed technical indicators. The most common use of RSI is the identification of divergences:
Developed J. Welles Wilder, the Relative Strength Index (RSI) is a momentum oscillator that measures the speed and change of price movements...According to Wilder, divergences signal a potential reversal point because directional momentum does not confirm price. A bullish divergence occurs when the underlying security makes a lower low and RSI forms a higher low. RSI does not confirm the lower low and this shows strengthening momentum. A bearish divergence forms when the security records a higher high and RSI forms a lower high. RSI does not confirm the new high and this shows weakening momentum. StockCharts.com
The monthly chart of Dow Jones Industrial Average has registered a bearish divergence at the 2011 and 2012 highs:
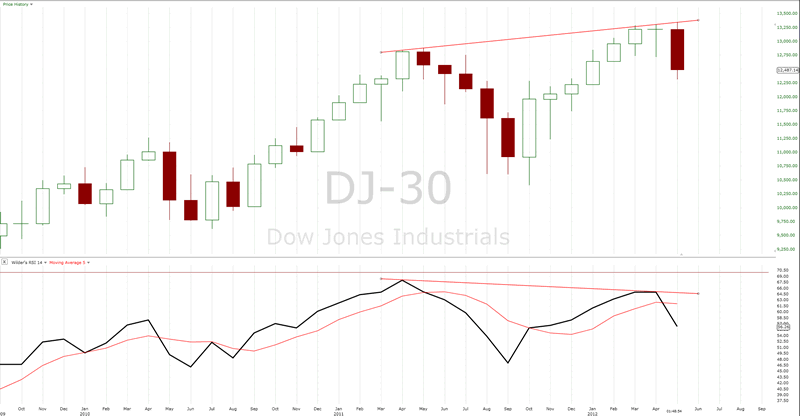
I went through the monthly data on INDU going back to 1971. In 100% of occurrences of the signal an average decline of 27.9% lasting an average period of 10.8 months resulted. Since 1971 in all 11 occurances of a bearish monthly RSI divergence a significant decline of at least 16% followed. There was only one top of significance that did not register this signal and that occured in 1973. That means that during a forty year period starting in 1971, 91.6% of all significant tops recorded this technical signal. That is a period that encompasses two bear markets and a major bull market as well, which means there is a firm record of this technical condition resulting in serious bear markets under a wide range of well identified market conditions.
Here's a list of the tops regsitering a monthly RSI divergence and the subsequent percentage decline. Click on the link to see a chart of the occurrence:
YEAR, PERCENT DECLINE, DURATION OF DIVERGENCE, MONTHS OF DECLINE
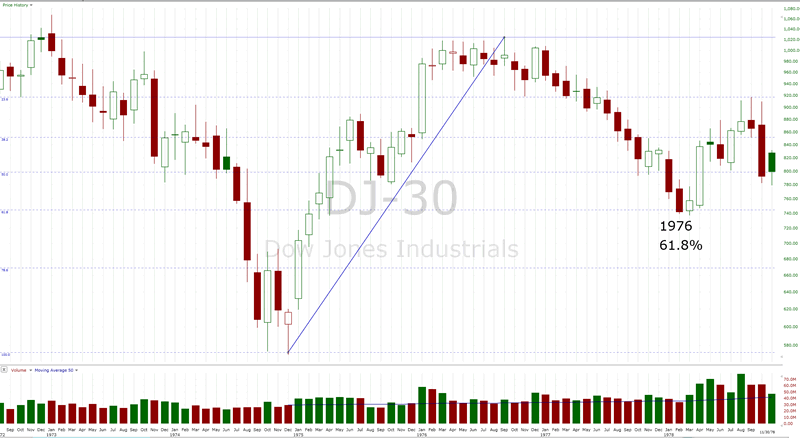
1976, -28%, 5, 19
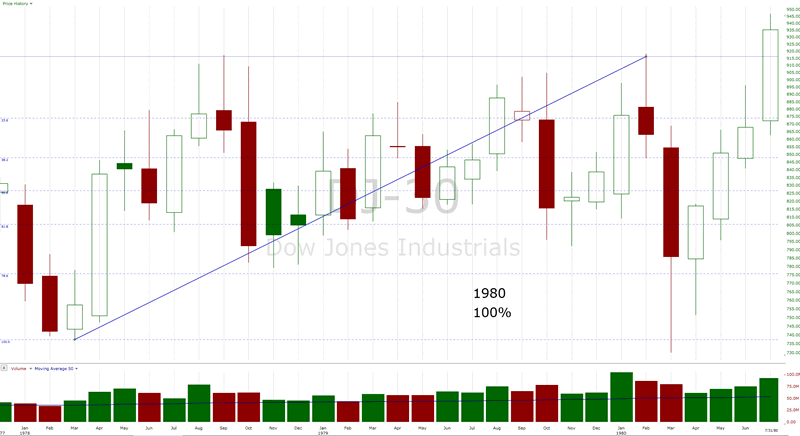
1980, -21%, 5, 2
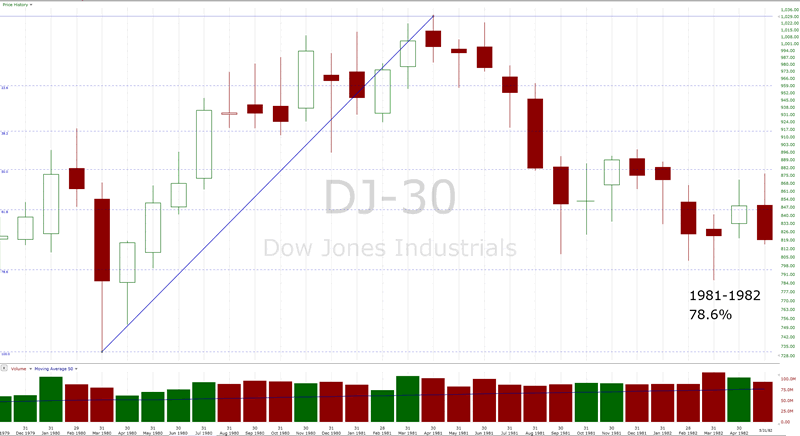
1981, -25%, 4, 17
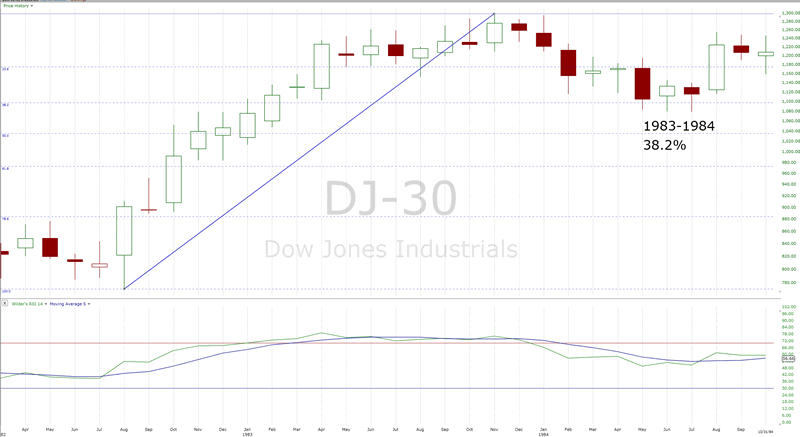
1983, -17%, 6, 8
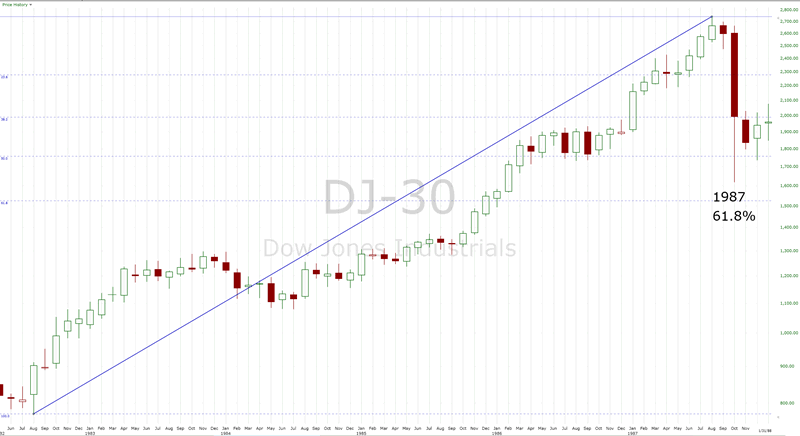
1987, -41%, 16, 3
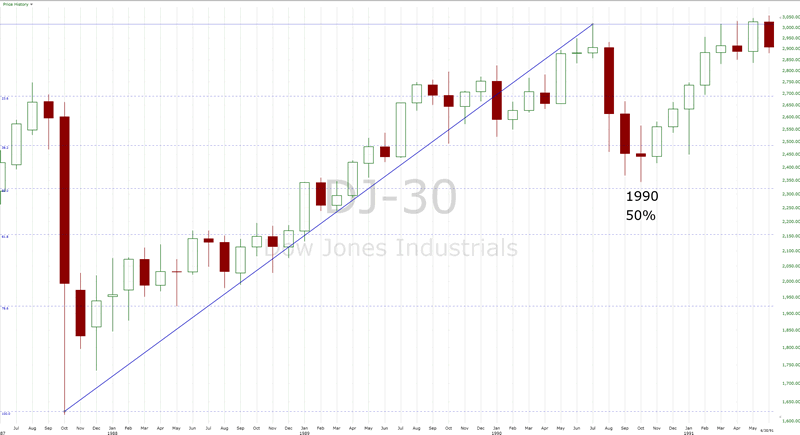
1990, -22%, 10, 4
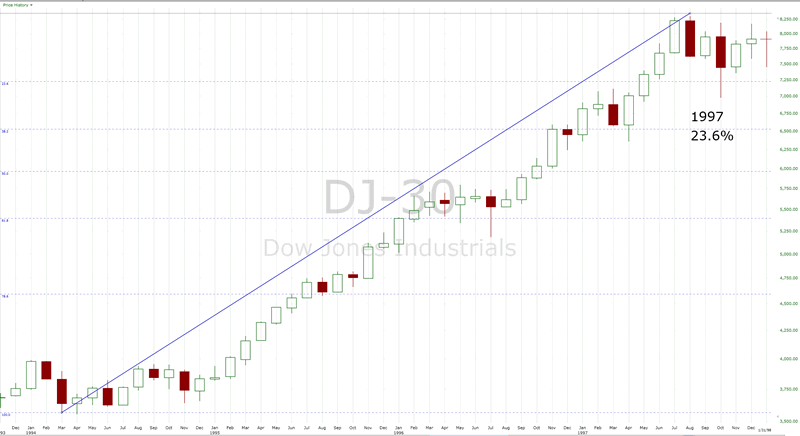
1997, -16%, 7, 3
1998, -16%, 11, 3
2000, -39%, 8, 34
2007, -54%, 4, 18
2012, -??%, 11, ??
■The average percentage decline is 27.9%
■The average duration of the bearish divergence (difference in the number of months between each price top) is 7.91 months.
■The average numbers of months of the decline is 10.8
■The average monthly decline is 3.58%.
■Removing the outliers of 54% and 16% the average percent decline is 26.13%
■Removing the outliers of a 16 month divergence in 1987 and a 4 month in 1981, the average duration of divergence is 7.4 months.
■Removing the outliers of 34 months and 2 months, the average length of decline is 7.5 months.
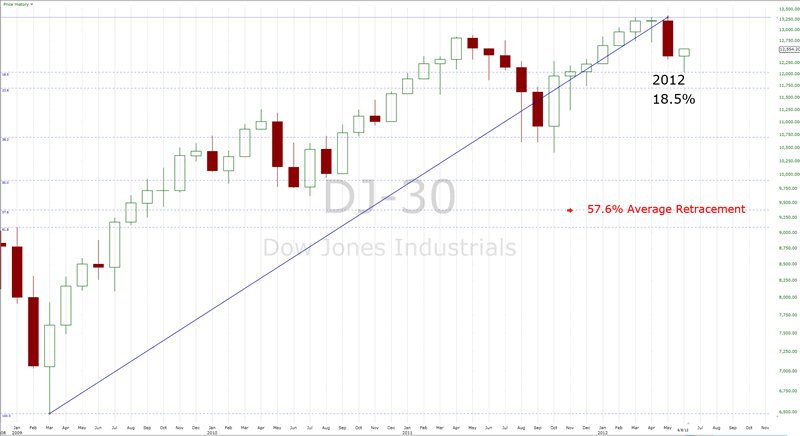
The current bearish monthly divergence took 11 months to develop, about 3.5 months longer than average. This is the second longest build to a bearish monthly RSI divergence, the first being the 16 month period leading up to the 1987 top and decline of 41%. The current market is only 5 weeks off the divergent price top or 38 weeks short of the average and the maxium decline to date is about 9.8% or 18.1% less than the average drop. Altogether this suggests the probability of considerable more downside in terms of time and price yet to come in this bear market.
The average percentage retracement following a monthly RSI divergence is 57.6%.
The nearest Fibonacci retracement percentage level of the prior wave which it corrected for each signal is shown:
1976-1978 61.8%
1980 100%
1981-1982 78.6%
1983-1984 38.2%
1987 61.8%
1990 50.0%
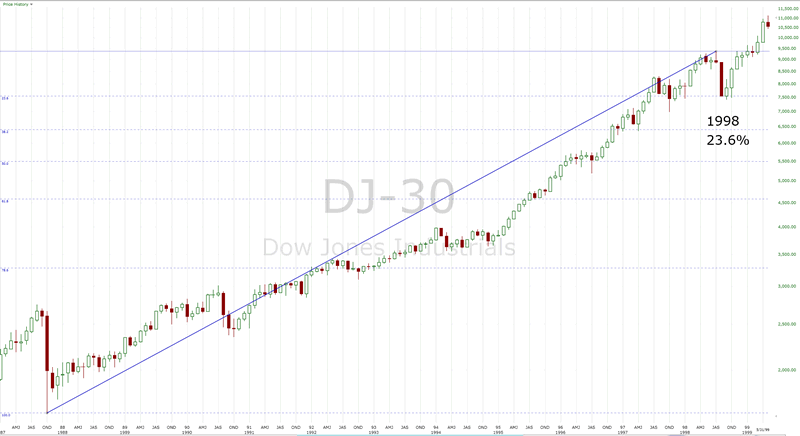
1997 23.6%
1998 23.6%
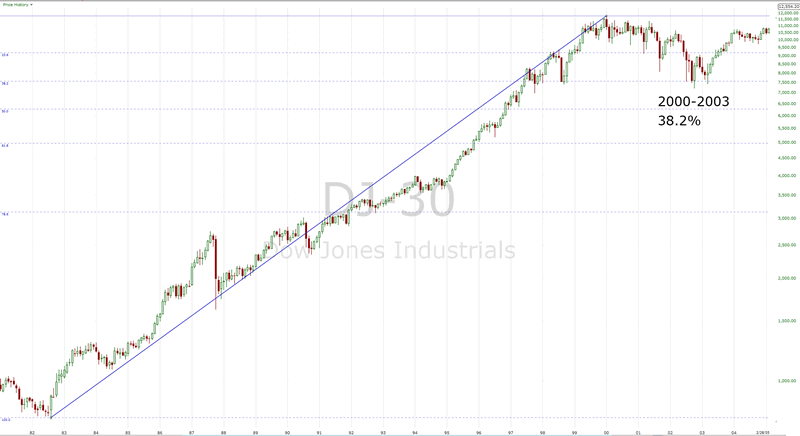
2000-2003 38.2%
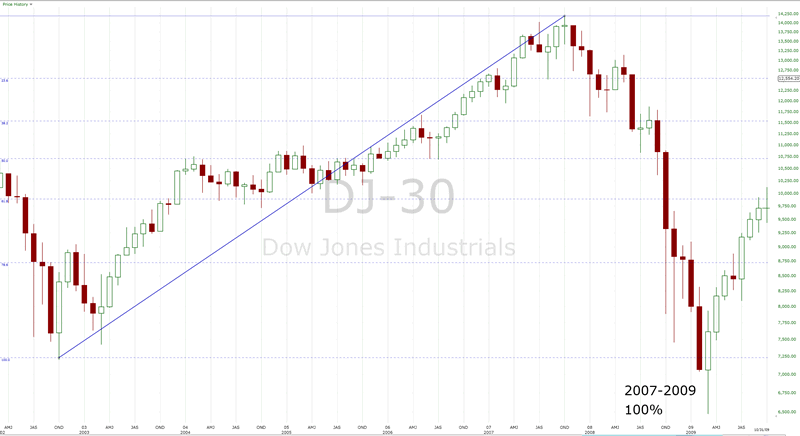
2007-2009 100%
If this occurance of the Monthly RSI Divergence results in an average retracement it would entail a decline to Dow 9380 or a drop of 26% from current levels and it would bottom in December of 2012 at about 9290.
The usefulness of this signal for identifying major tops which result in an average bear markets of 27% is evident. On its own it would be a powerful cause for investors to evaluate their market position. Since it is accompanied by an extensive raft of other strongly bearish technical indications, it should be taken as an actionable signal.
While a short term, news driven bounce is likely, it should be regarded as the last, best chance for investors to exit the market before a major decline ensues. Front running the announcement of "easing" by global monetary authorities may work for a period ranging from a few days to a month or so but it is likely to be punished severely in the end.
Go here to read the full BullBear Market Report:

Disclosure: No current positions.
By Steve Vincent
Steven Vincent has been studying and trading the markets since 1998 and is a member of the Market Technicians Association. He is proprietor of BullBear Trading which provides market analysis, timing and guidance to subscribers. He focuses intermediate to long term swing trading. When he is not charting and analyzing the markets he teaches yoga and meditation in Los Angeles.
© 2011 Copyright Steven Vincent - All Rights Reserved Disclaimer: The above is a matter of opinion provided for general information purposes only and is not intended as investment advice. Information and analysis above are derived from sources and utilising methods believed to be reliable, but we cannot accept responsibility for any losses you may incur as a result of this analysis. Individuals should consult with their personal financial advisors.
© 2005-2022 http://www.MarketOracle.co.uk - The Market Oracle is a FREE Daily Financial Markets Analysis & Forecasting online publication.