


U.S. Treasury Bonds Bear Market Underway?
Interest-Rates / US Bonds Jul 03, 2012 - 03:27 AM GMTBy: Tony_Caldaro

 We believe the multi-decade Bond bull market is coming to an end. We have been tracking the typical choppy action in long, and short, term rates for a number of years now. While many turned bearish on Bonds in 2010 and 2011, we remained bullish for two specific reasons. First, the 30 year Bond rate had not made a new bear market low. Second, the declining phase of the 68 year Bond cycle had not displayed any signs of bottoming. Recently this has changed.
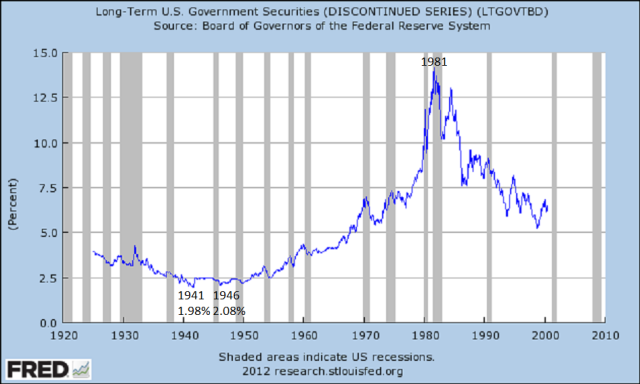
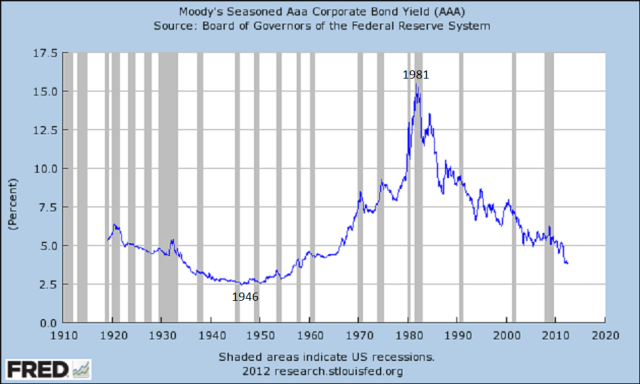
Historically, Bond rates rise for about 34 years and then decline for about the same period of time. Naturally, as the economy and/or perceived inflation changes Bond rates change. Yet, these changes in rates remain within the overall rising/declining cycle. Notice Bond rates bottomed in 1941, were fixed at around 2.5% during the War, then made a secondary bottom in 1946. Confirming this secondary bottom as the actual low were AAA Corporate rates. Which were not fixed during the War.
After Bond rates bottomed in 1946 they rose for 35 years into a 1981 peak. Since then Bond rates have been generally declining now for 31 years. This is a very long cycle. Normally, we would have expected Bond rates to bottom in 2014: exactly 68 years from the 1946 low. However, since this is only two years away now is the time to start looking for evidence of the 68-year Bond Cycle low. Especially when so many are heavily invested in Bonds.
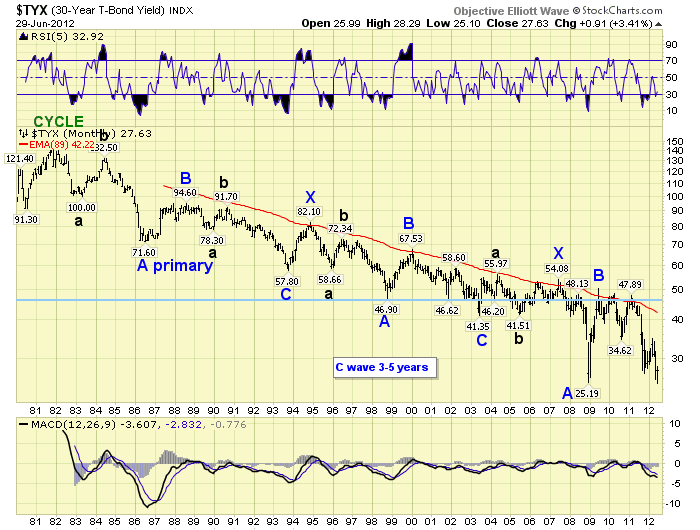
The first thing we would naturally look for, since we use OEW analysis, is a potentially completed wave pattern from the 1981 peak in rates. Currently, we can see a potentially completed triple zigzag wave formation with the X waves in 1994 and 2007 separating the three zigzags. Notice these X waves were exactly 13 years apart from the 1981 high. Also notice the Primary C waves of each zigzag were 3 to 5 years in duration. We had a Primary B wave peak in 2009. This suggests a low in long term rates between 2012 and 2014. In June the 30-year Bond hit its lowest level since 1946, and the 10-year Bond hit its lowest level ever at that time as well. This market activity met has our first condition: a new rate low in the 30-year Bond. And, possibly our second: technical signs of long term rates bottoming.
Since it is important to observe related sectors when examining any asset class. We have been tracking the one year Treasury Bill rate as well. Historically, we have found, the 1-year rate actually leads the FED Funds rate over time. When the 1-year rate hits a certain threshold it suggests to the FED that rates should be raised or lowered accordingly. Unfortunately, there is usually a lag in the FED’s response which sometimes leads to trouble in the economy. We published a piece on this phenomenon early last year: http://caldaro.wordpress.com/2011/01/1....
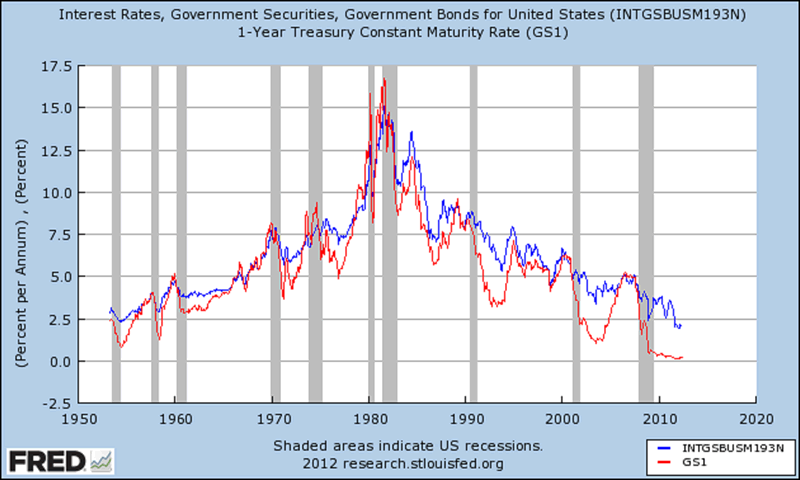
Historically, as you can observe from the above chart, long term and short term rates generally move together. The reason for the changes in rates are typically expansion or contraction, and possibly inflation or deflation, in the economy. Most of the time there appears to be a direct correlation between highs and lows. Yet, there are times when short term rates lead long term rates, and rarely the other way around. Notice the early 1970 peak, the mid-1970′s peak, the early 1990′s low and the recent mid-2000′s peak. Each time 1-year rates led the reversal in long term rates.
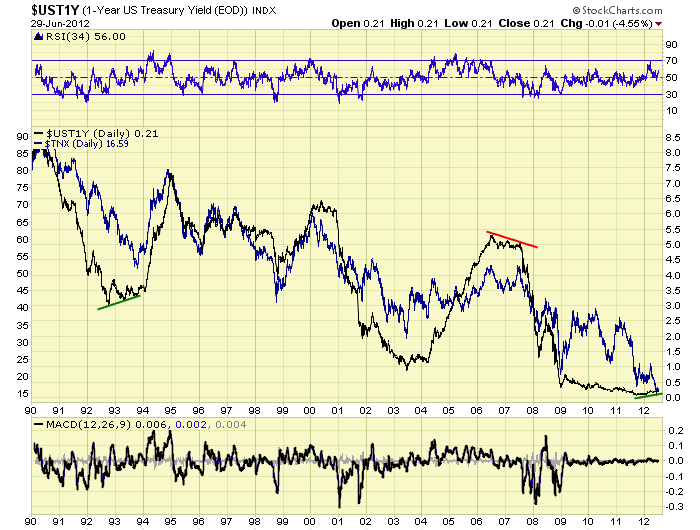
We took a closer look at these two latest instances. Observe short term rates bottomed in the second half of 1992, but long term rates did not bottom until the second half of 1993. After that rates soared. Next observe the same relationship, but in reverse. Short term rates peaked in mid-2006, but long term rates did not peak until mid-2007. After that rates fell sharply. Now let’s zoom in to current market conditions.
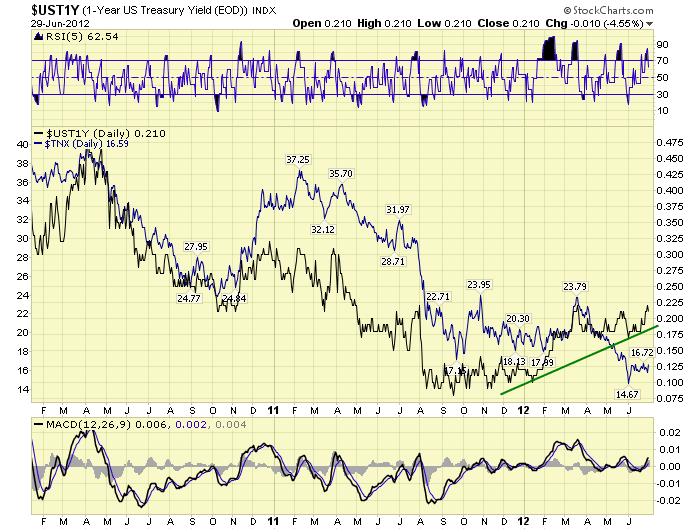
As noted earlier long term rates recently made a lower low in June, (blue line). But look at short term rates, (black line). The 1-year rate has been gradually increasing since Sept 2011, after it hit a record low of 0.08%. The divergence is striking! And, it has very important long term implications. But we’re not done!
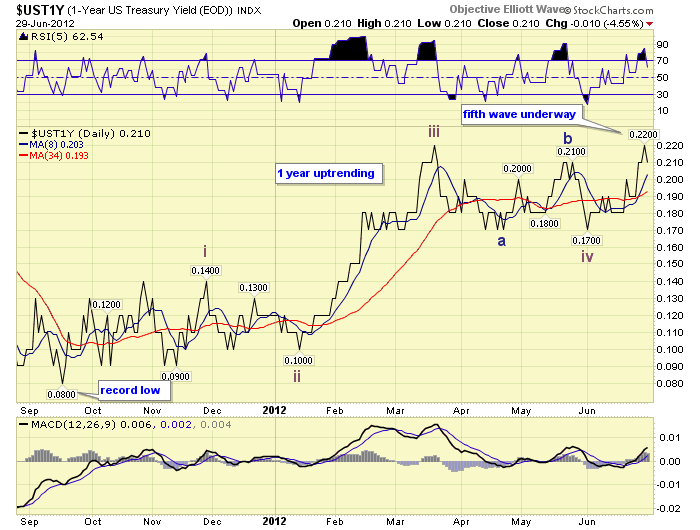
When we review the wave action since the September low in 1-year rates, we can clearly see a bullish five waves up in rates. Certainly the 1-year has only moved from 0.08% to 0.22% in yield. But the five wave pattern is quite obvious even at these low levels. This suggests 1-year rates are entering a bull market. And, long term rates will shortly follow. We now believe all the technical conditions are in place for a new multi-decade up cycle in long term rates. Bond prices, at these historically low rates, will now likely be subject to price erosion over time. Unless, held to maturity
CHARTS: http://stockcharts.com/...
http://caldaroew.spaces.live.com
After about 40 years of investing in the markets one learns that the markets are constantly changing, not only in price, but in what drives the markets. In the 1960s, the Nifty Fifty were the leaders of the stock market. In the 1970s, stock selection using Technical Analysis was important, as the market stayed with a trading range for the entire decade. In the 1980s, the market finally broke out of it doldrums, as the DOW broke through 1100 in 1982, and launched the greatest bull market on record.
Sharing is an important aspect of a life. Over 100 people have joined our group, from all walks of life, covering twenty three countries across the globe. It's been the most fun I have ever had in the market. Sharing uncommon knowledge, with investors. In hope of aiding them in finding their financial independence.
Copyright © 2012 Tony Caldaro - All Rights Reserved Disclaimer: The above is a matter of opinion provided for general information purposes only and is not intended as investment advice. Information and analysis above are derived from sources and utilising methods believed to be reliable, but we cannot accept responsibility for any losses you may incur as a result of this analysis. Individuals should consult with their personal financial advisors.
© 2005-2022 http://www.MarketOracle.co.uk - The Market Oracle is a FREE Daily Financial Markets Analysis & Forecasting online publication.