


Global Stock Markets Uptrend Ready to Resume
Stock-Markets / Stock Markets 2012 Jul 08, 2012 - 04:23 PM GMTBy: Tony_Caldaro

 Overall it was a good week for the US stock market. The SPX eclipsed its previous uptrend high at 1363, on its way to 1375 on tuesday. Then after the mid-week holiday a pullback followed, from extremely overbought condtions. By week’s end the SPX/DOW were -0.7%, but the NDX/NAZ were flat. Overseas markets were mixed as well, with Asia +1.3%, Europe -1.1%, and the DJ World index -0.2%. On the economic front it was another positive week with positive reports outpacing negative ones 7 - 3. On the downtick: ISM manufacturing/services and investor sentiment. On the uptick: construction spending, factory orders, auto sales, the ADP index, the WLEI, plus Payrolls rose and weekly jobless claims declined. Next week we’ll have the FOMC minutes, the twin deficits and the PPI.
LONG TERM: bull market
As we near the end of the seventh year of writing this blog the US bull market we have been tracking remains intact. While many EW’ers have disagreed with our analysis over the years. For the most part I think we have helped investors navigate these treacherous markets during this deflationary secular bear cycle.
Our super long term count continues to suggest a multi-century Grand Supercycle bull market ended in 1929. Then the stock market lost 89% of its value in just 34 months in a Grand Supercycle bear market. At that July, 1932 DOW 41.22 low the next multi-century GSC began. Within a GSC bull market there are five Supercycle waves. The first Supercycle, SC1, concluded in October, 2007 at DOW 14,198. The decline that followed that peak was the largest since that 1929-1932 bear market. The DOW lost 54% of its value in just 17 months. This was a faster rate of decline than even the GSC bear market. In March, 2009 SC2 ended at DOW 6470, and a multi-decade SC3 bull market began.
Supercycle bull markets unfold in five Cycle waves. The first Cycle wave, [1], has been underway since that low. The first Cycle wave of SC1 (1932-2007), took five years to unfold (1932-1937). This one may take that long, or end one year shorter in 2013. It all depends on how long the waves take to unfold. Within each rising Cycle wave is five Primary waves. Primary waves I and II concluded in April and October 2011. Primary wave III has been underway since that October low. When it concludes the market should experience a Primary wave IV correction, followed by a rising Primary wave V to end the bull market and Cycle wave [1]. After that a Cycle wave [2] bear market should follow for two or three years. Then the real excitement begins as Cycle wave [3] kicks off.
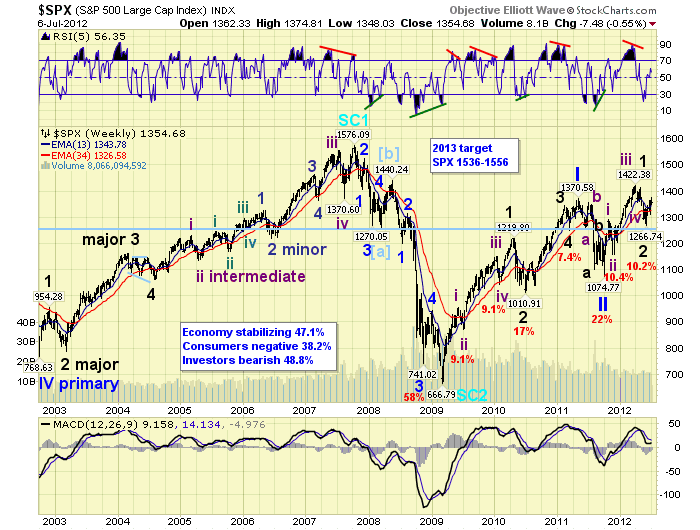
Our weekly chart displays the SC1 2007 top, SC2 2009 bottom, and the current Cycle wave [1] bull market. Our indicators continue to perform in the usual bullish mode. The MACD has remained mainly above neutral. Plus, the RSI has been getting quite overbought during uptrends and barely oversold during downtrends. Observe these indicators during the previous 2002-2007 bull market. Currently we have a bull market target between SPX 1536 and 1556 by 2013.
MEDIUM TERM: uptrend
After the Primary wave II low the market advanced in five Intermediate waves to complete Major wave 1, of Primary III. Notice Major wave 1, of Primary I, also subdivided into five Intermediate waves. The Major wave 2 correction that followed was shorter than the previous Major wave 2, in time. Major 2, Primary I, was three months. But Major 2, of Primary III, was only one month.
What we are expecting now is an extended, multi-month, possibly into the end of the year, uptrend for Major wave 3. During this bull market we have observed two uptrends that have lasted for seven months: Intermediate iii of Major 1, and Major 3 of Primary I. Our upside target for this entire advance is the OEW 1499 pivot.
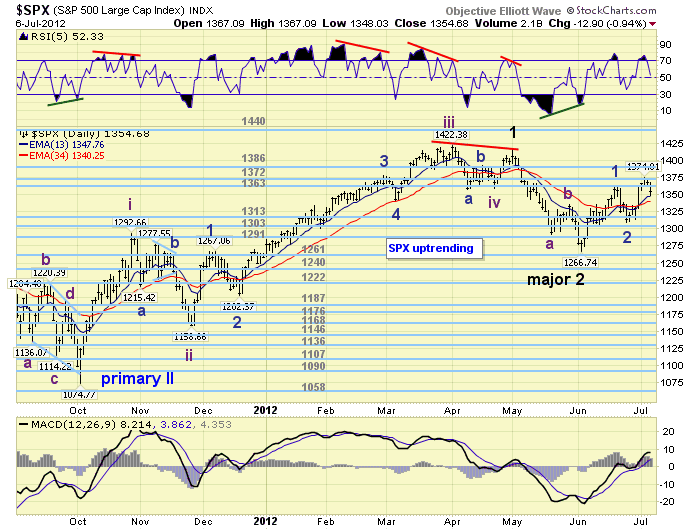
Currently we are counting the first rally off the Major 2 SPX 1267 low to SPX 1363 as Minor wave 1, or possibly Intermediate wave i. The pullback to SPX 1309 is counted as Minor 2, or possibly Intermediate ii. Minor wave 3, (or Intermediate iii), has been underway since that low. If all goes as expected, the pullbacks during this wave should be relatively small, 20 – 30 SPX points, until it completes in a few months.
SHORT TERM
SPX support is at the OEW 1313 and 1303 pivots, with resistance at the 1363 and 1372 pivots. The uptrend has progressed from SPX 1267 to 1363, Minor wave 1. Then pulled back to SPX 1309/10/13, Minor wave 2. The recent rally to SPX 1375 looks like Minute wave i, with friday’s 1348 low Minute wave ii of Minor 3. While a further pullback for Minute ii is possible we think it’s unlikely at this time since the market did get quite oversold. Once the SPX clears the 1358 level we believe the uptrend should resume to new highs.
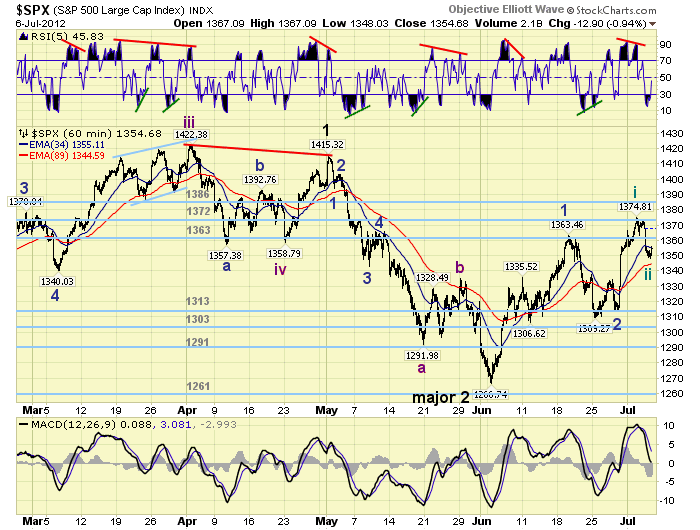
Short term support is at the SPX 1342/47 area and then 1334/38. Overhead resistance is at the 1363 and 1372 pivots. Short term momentum hit quite oversold on friday before rebounding toward neutral. The short term OEW charts remain positive with the swing point still around SPX 1350. Best to your trading and week!
FOREIGN MARKETS
The Asian markets were mostly higher on the week for a net gain of 1.3%. All but China are in confirmed uptrends.
The European markets were mostly lower on the week for a net loss of 1.1%. All indices are in confirmed uptrends.
The Commodity equity group were all higher on the week for a net gain of 1.0%. All but Brazil are in confirmed uptrends.
The DJ World index is uptrending but lost 0.2% on the week.
COMMODITIES
Bonds remain somewhat resilient gaining 0.7% on the week and still in an uptrend.
Crude had its usual volatile week losing 0.7%, but is uptrending.
Gold gave up 0.8% on the week, but remains in an uptrend.
Currencies have been wild of late. The USD confirmed down, then up again recently gaining 2.1% this week. The EUR is downtrending again losing 3.0%, while the downtrending JPY gained 0.2%.
NEXT WEEK
Monday kicks off the economic week with Consumer credit at 3:00. Wednesday we have the Trade deficit, Wholesale inventories, and the FOMC minutes. Then on thursday, weekly Jobless claims, Export/Import prices, and the Budget deficit. Friday, the PPI and Consumer sentiment. The FED has nothing scheduled at this time. Best to your weekend and week!
CHARTS: http://stockcharts.com/...
http://caldaroew.spaces.live.com
After about 40 years of investing in the markets one learns that the markets are constantly changing, not only in price, but in what drives the markets. In the 1960s, the Nifty Fifty were the leaders of the stock market. In the 1970s, stock selection using Technical Analysis was important, as the market stayed with a trading range for the entire decade. In the 1980s, the market finally broke out of it doldrums, as the DOW broke through 1100 in 1982, and launched the greatest bull market on record.
Sharing is an important aspect of a life. Over 100 people have joined our group, from all walks of life, covering twenty three countries across the globe. It's been the most fun I have ever had in the market. Sharing uncommon knowledge, with investors. In hope of aiding them in finding their financial independence.
Copyright © 2012 Tony Caldaro - All Rights Reserved Disclaimer: The above is a matter of opinion provided for general information purposes only and is not intended as investment advice. Information and analysis above are derived from sources and utilising methods believed to be reliable, but we cannot accept responsibility for any losses you may incur as a result of this analysis. Individuals should consult with their personal financial advisors.
© 2005-2022 http://www.MarketOracle.co.uk - The Market Oracle is a FREE Daily Financial Markets Analysis & Forecasting online publication.