How Long More for Stocks?
Stock-Markets / Stock Markets 2012 Jul 20, 2012 - 12:57 PM GMTBy: Ashraf_Laidi
 Equity indices may be selling off after 3 consecutive rising days, but this weeks shrugging of poor data by equities cannot be ignored. Equities resilience to pervasively negative economic data (US and abroad) is taking a life of its own.
9-month lows in the US June leading economic indicators index, 8-month lows in US existing home sales and double digit negative reading in the June Philly Fed indexall on the back of the 3rd consecutive monthly decline in US retail sales should be sufficiently negative for equities. Yet indices were still up 2.7-3.0% since Monday.
Whether the rationale is based on the inevitability of further stimulus action from the Fed/ECB, or the avoidance of horrible scenarios in US corporate earnings, the resilience of equities cannot be ignored as technicals suggest further gains into the end of summer.
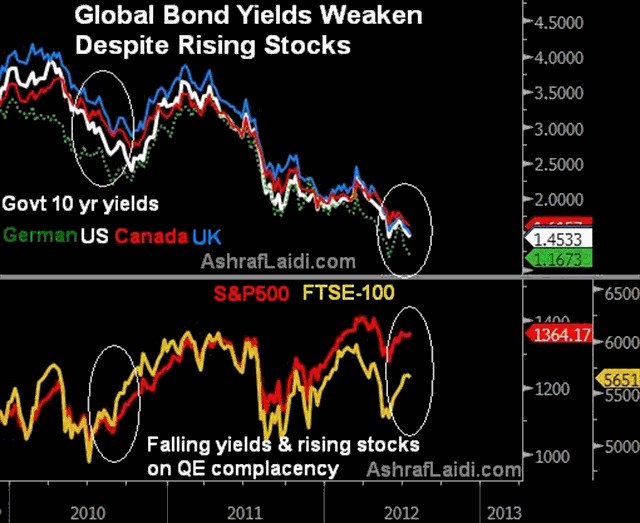
The resurfacing inverse relation between equities and global 10-year yields over the past 4 weeks backs the aforementioned rationale-- Ongoing data weakness has globalised the easing campaign of major central banks, and raising traders confidence, thereby driving yields lower and lifting equities higher. US 10 year bond yields have fallen a remarkable 17 bps from the June 22 high of 1.67% to 1.49%. The last time we saw these dynamics was in autumn 2010 when the anticipation of a 2nd round of QE from the Fed sured up global equities alongside a decline in bond yields.

When is the Next Meaningful Sell-off?
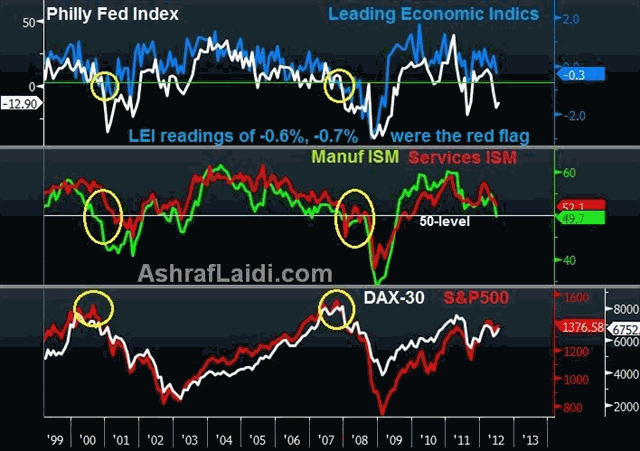
We may not see the next meaningful decline in equities until both the manufacturing and services ISMs fall below 50 and extend their fall below 45.0. So far, the services ISM has not yet fallen under 50.0. Even a decline below 50 may prove a 1-time affair before subsequently regaining 50.0--as we saw in January 2007. Thus, only a reading of 47 in both ISMs would be a meaningful red-flag.
The seldom-discussed Leading Economic Indicators index has long been frowned upon by Wall Street as a misleading indicators index, but the chart below show consistency during recessions. Yesterdays release showed -0.3% in June, the biggest decline in 9 months. The LEI index would have to post a monthly decline of 0.6 to 0.7% in order for it to be accompanied with sufficient macroeconomic deterioration and escalating bearishness in equities. The chart shows declines of 0.6%-0.7% in the LEI were consistent with bear markets in equities and recessions. In order for a decline of such magnitude in the LEI and both ISMs under 48-47 to occur, this may have to wait until Q4, which is a fitting time for markets to demand additional Fed stimulus to the existing Operation Twist-such as QE.

Intere stingly, chatter is already making the rounds (from an advisory firm) that a few dovish Fed members are drumming up support for further QE before year-end. It is inevitable that such rumours will resurface ahead of the Jackson Hole Fed conference of world central bankers in August.
EURUSD correlation with equities appears to be weakening again, but the real emerging pattern is that EURUSD is among the first pairs to decline during falling equities and risk off patterns and among the lagging pairs to rally during improved market sentiment. Conversely, G10 equities, specifically, US and Germany, have seen their gains relatively amplified during decent data or positive news flow, and displayed short-lived losses during negative news.
A possible rationale for these moves is that any additional measures from the Fed (such as quantitative easing) are seen more effective in propping up equities (as was the case in the December and February LTROs) than they are in lifting the fundamentally and structurally damaged euro.
Get your free 1-week trial to our Premium Intermarket Insightson FX, commodities & equity indices
For more frequent FX & Commodity calls & analysis, follow me on Twitter Twitter.com/alaidi
By Ashraf Laidi
AshrafLaidi.com
Ashraf Laidi CEO of Intermarket Strategy and is the author of "Currency Trading and Intermarket Analysis: How to Profit from the Shifting Currents in Global Markets" Wiley Trading.
This publication is intended to be used for information purposes only and does not constitute investment advice.
Copyright © 2012 Ashraf Laidi
Ashraf Laidi Archive |
© 2005-2022 http://www.MarketOracle.co.uk - The Market Oracle is a FREE Daily Financial Markets Analysis & Forecasting online publication.


