


Stock Market Gathering Storm Clouds
Stock-Markets / Stock Markets 2012 Jul 23, 2012 - 10:23 AM GMTBy: Andre_Gratian

 Current position of the market
SPX: Very Long-term trend – The very-long-term cycles are down and, if they make their lows when expected (after this bull market is over) there will be another steep and prolonged decline into late 2014. It is probable, however, that the steep correction of 2007-2009 will have curtailed the full downward pressure potential of the 120-yr cycle.
SPX: Intermediate trend – SPX is in a limited intermediate uptrend which is estimated to end in the first week of August.
Analysis of the short-term trend is done on a daily basis with the help of hourly charts. It is an important adjunct to the analysis of daily and weekly charts which discusses the course of longer market trends.
Daily market analysis of the short term trend is reserved for subscribers. If you would like to sign up for a FREE 4-week trial period of daily comments, please let me know at ajg@cybertrails.com
Market Overview
From last week:
“Should conditions remain as they are during this rally phase, the SPX would be expected to reach about 1380, and could even stretch to the low 1400s. Being able to overcome resistance around 1362 will determine whether or not these projections can be reached.”
Once again, the SPX obliged with the forecast of a week ago. When this prediction was made, the SPX stood at 1357.70 after a strong rally on Friday 7/13. This was seen as the resumption of an intermediate uptrend which had started from 1267 on 6/04, and was expected to reach 1380, at a minimum. In fact, last Thursday the SPX rose to 1380.39 before it started to retrace. By Friday, it became obvious that, after meeting its lower target dead on, the short-term trend had been interrupted and a correction had started.
This correction is not expected to be long-lasting and could end as early as 7/25, around 1345 max.
After that, an extension of the intermediate uptrend could take place, driving prices into the low 1400s
before ending sometime in early August.
That’s the forecast for the short-term. What about the long term? I have said all along that there will be a long-term correction (bear market) into the Kress 120-yr cycle low which ideally bottoms in October 2014. While SPX, DJIA and NDX are attempting to keep alive their bull market trend from 2009, long-term deceleration is taking place in other indices and raising a red flag. This is evident in the broader NYSE index when compared to the SPX in the following charts (courtesy of Qcharts).
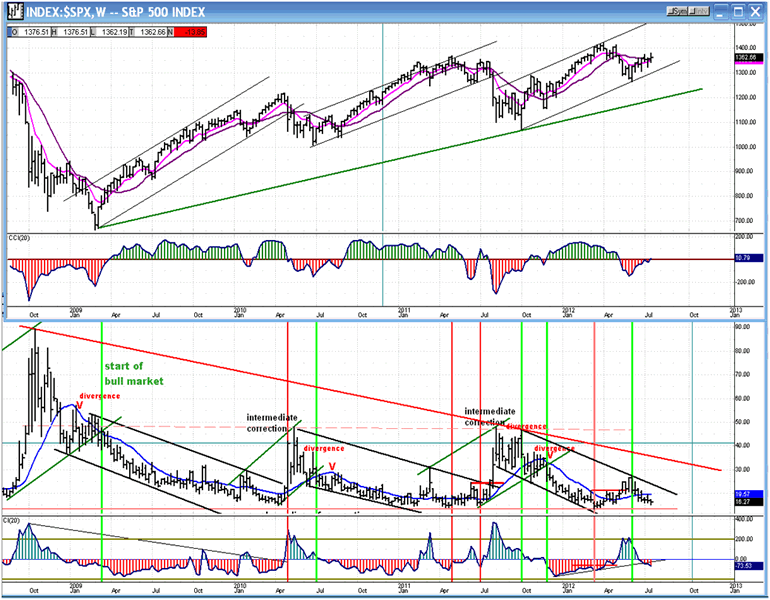
Chart analysis
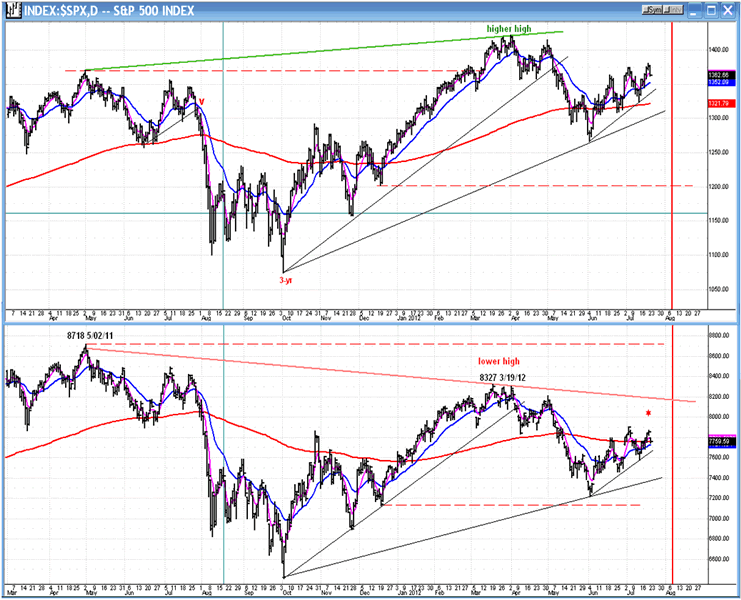
There is no question that the broader index is relatively weaker than the SPX. Both indices made similar recovery highs from their March 2009 lows, and comparable weakness took place in both during the subsequent correction which ended in October 2011. It is in the price action during the next rallies into March 2012 that we start seeing long-term deceleration asserting itself in the NYSE. While SPX went on to surpass its May 2011 peak, the NYSE fell far short of it before starting to decline again. The same thing happened on a smaller scale last week. SPX made a marginal new high, but NYSE did not.
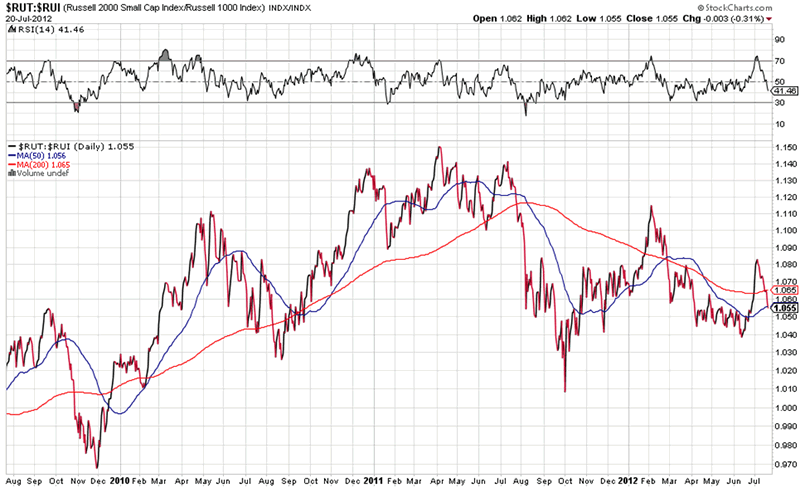
In order to make this long-term divergence more graphic, I have drawn trend lines across the May 2011 and March 2012 peaks of both indices. This shows that the SPX, having made a higher high, is still in an uptrend, while the NYSE which made a lower high, is already in a potential long-term downtrend. The relative weakness of the NYSE suggests that fewer stocks are participating in the bull market. These stocks are the small caps and this relative performance is best expressed in the following chart of the Russell 2000 (small caps) vs. Russell 1000 (large caps) -- courtesy of StockCharts.com-- which gives you essentially the same picture as the one above, but is more explicit in that it shows the small caps underperforming the large caps. Historically, this has been a negative for the market, foreshadowing the advent of a bear market if it persists.
Is it time to panic and sell everything you own? Not necessarily, and this is probably the mistake that the permabears are making in thinking it is. Some Elliott Wave analysts fall in that category. They believe that we have already started a bear market and that there is a devastating wave 3 just ahead. They are probably right, but their timing could be off.
Based on cycles, there are two time frames in which the market could start a vicious decline. One is relatively nearby, as close as mid-August. If this time frame fails to trigger something substantial, then the day of reckoning will probably be put off until the first quarter of 2013. Why don’t we wait and see which one the market chooses?
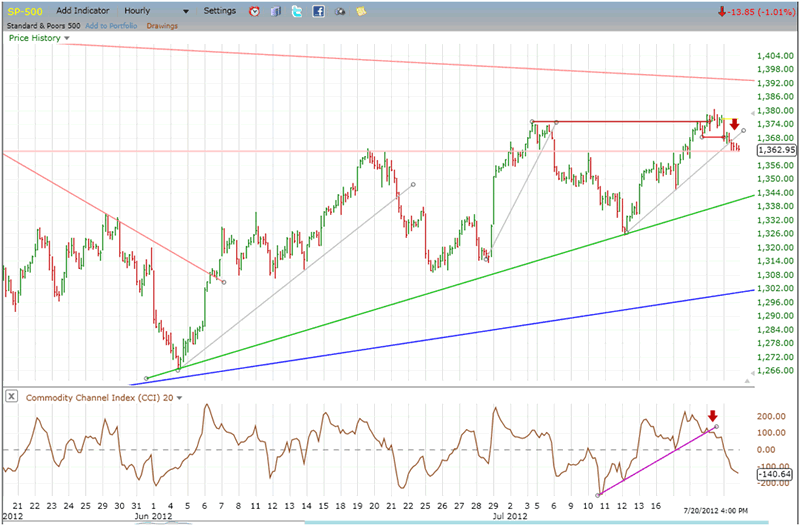
For analysis of the short term, we’ll turn to the Hourly Chart of the SPX. The blue trend line represents the “long” intermediate trend from October 2011. The green trend line connects lows from 1267 and denotes the “short” intermediate trend. For now, both trends are still rising, but after 5 waves from the low, the SPX appears to have given a short-term sell signal. This is reflected in the price action, and is even more apparent in the indicator which showed some divergence at the top prior to breaking its trend line.
So far, the index has retraced to a very strong support level around 1360, and it may have a bounce before going lower. The chart shows that prices held above support for four hours without penetrating it and it would not be surprising to see an attempt at resuming the uptrend on Monday morning. However, short-term cycles due to make their lows around 7/25 should pull the index down below the support line, perhaps as far as 1346, which is a reasonable projection according to the P&F chart. Whether or not these cycles will be strong enough to propel the SPX back in an uptrend remains to be seen, but since the next top is expected around early August, it’s possible.
Cycles
From last week -- and still pertinent -- is this quote:
“A minor cycle is due Tuesday, and another one around the 20th. Over the short term, the most important cycles will form a cluster in the second week of August. At this time, they are expected to bring about a high, but should they bring a low instead, it would make a big difference in the trend pattern.”
A short-term reversal occurred on Friday 20th, so the market obliged in time as well as in price.
The only thing to add for the short-term is that, as mentioned above, minor cycle lows are expected around the 25th.
Breadth
Below is the NYMO superimposed on the NYSI (both courtesy of StockCharts.com).
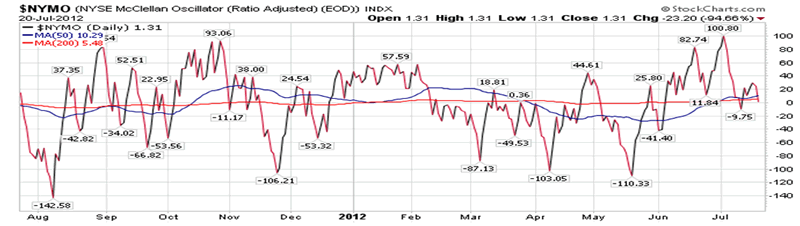
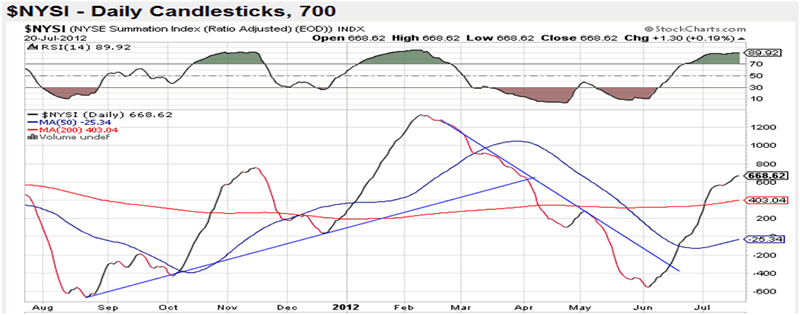
If there was anything that was forecasting a near-term reversal, it was breadth. Look at the action of the NYMO last week while the market was making new intermediate highs. It’s difficult to find more striking negative divergence. But that has not been followed by a great deal of weakness – at least not yet! The index has only returned to neutral and we’ll have to see what the next few days bring.
It’s obviously not a time to get too bullish. Take a look at the NYSI. Not only is it beginning to flatten out, an indication that the intermediate trend may be about to reverse, but look at the RSI, which is just about as overbought as it gets. A cautionary stance is appropriate.
Sentiment Indicators
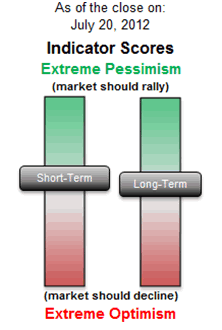
While some indicators are exerting caution, when we look at the SentimenTrader (courtesy of same) it’s very difficult to get overly bearish about the stock market. This index has an excellent record of predicting important highs and lows and – unless it is totally blowing it, this time – it only shows that sentiment is neutral, contradicting those that are predicting gloom and doom.
The VIX (volatility index)
Below, we compare the SPX to the VIX (charts courtesy of Qcharts) with the help of weekly charts. Since the beginning of the bull market of March 2009, the up-phases in the SPX have been matched by down-phases in the VIX. I have drawn channel lines around both to make this more obvious. What is currently shown is that the SPX’s uptrend is matched by a downtrend in the VIX, with the latter making a new low and dropping below 16 on Thursday. Before we can call for a major top in the market -- which, granted, may already have taken place at 1422 – we would first need to see both indices get outside of their intermediate channels, and then break their long-term trend lines. Even then we still would not have a confirmed long-term downtrend. Both would have to overcome their respective former intermediate low and high. Only then could we say for sure that we have started a bear market.
Of course, I am not advocating that you wait for such a confirmation to take precautionary measures, but let’s at least see if there are other warning signs ahead of us beyond some trend deceleration!
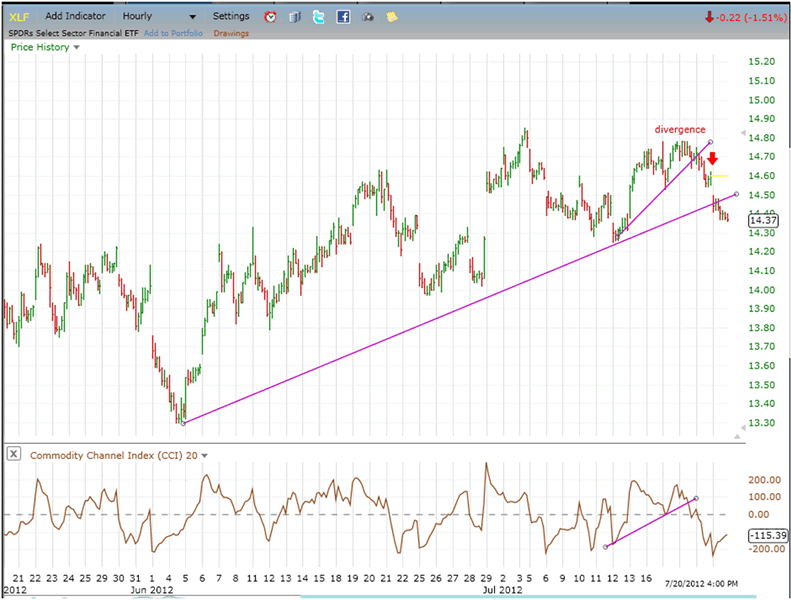
XLF (Financial SPDR)
I have mentioned a number of times that XLF is usually a good leading indicator. It certainly proved my point this time. The index stalled before making a new high while the SPX was overcoming its previous peak. This was a case of clear negative divergence in the XLF, although it was a little confusing because this is one time when the VIX actually misled us at the top of a short-term trend. Not visible on the weekly chart (above) but on Thursday, the VIX closed on its low of the day, suggesting that the SPX would try to go higher on Friday. There was no such ambiguity in the XLF. It clearly warned of a reversal.
The XLF also gave a warning on an intermediate basis when it refused to make a higher high on 4/01, while the SPX did. Now we have divergence on a shorter time frame as well. These are not bullish signs.
BONDS
TLT continues to defy gravity, seemingly ignoring what the SPX is doing. A week ago, it made a new
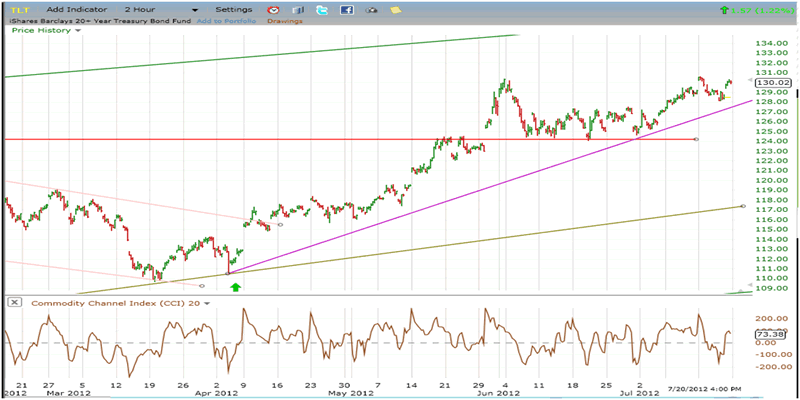
fractional high before pulling back a couple of points, but it was right back at its high as soon as the market started to correct.
Last week, I mentioned that if TLT was able to get past 130 decisively, it should be able to get up to 136-137 according to its P&F chart. This is still a valid projection.
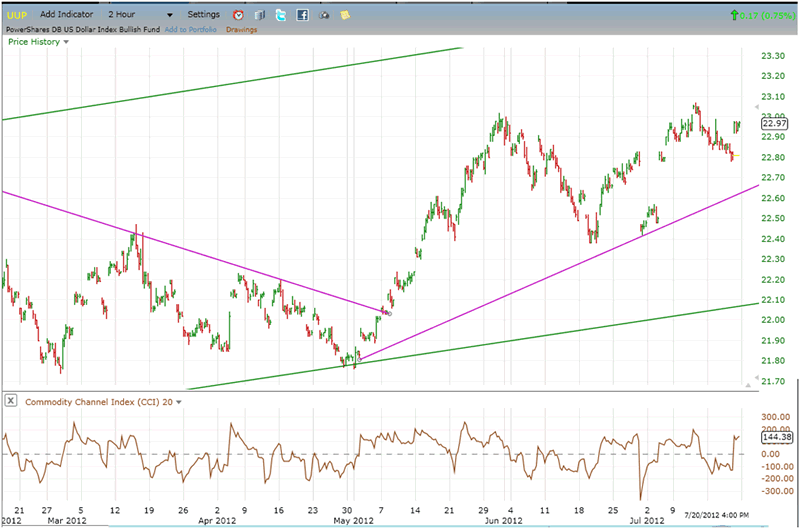
UUP (Dollar ETF) Daily Chart
The relationship between leading/confirming indicators and the SPX is not always clear and uniform. We are going through such a period, right now. That the SPX has started a correction is clear enough, and UUP is one of the indices that confirms it. I have expected UUP to next make a move to about 23.30, and it may now have the opportunity to do so. It would not take much for it to advance to a slightly new high, but for that, it would probably need the Euro to continue its downtrend, and the Euro may not want to do that! Although it made a slightly new low on Friday, the Euro appears to have essentially met its intermediate projection and is likely to resist further selling.
On Friday, UUP came within 8 cents of its former high. Let’s see if the Euro gives it the latitude it needs to keep going.
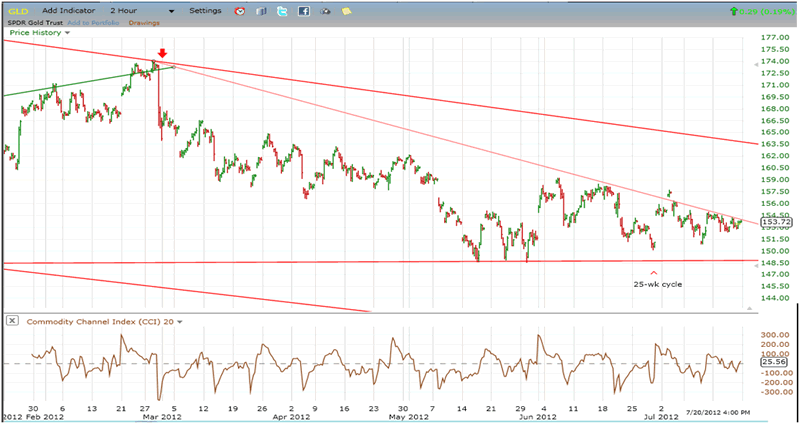
GLD (ETF for gold)
GLD continues to trade sideways, attempting several times to break above a declining secondary trend line, but failing to do so. However, the longer it resists getting severely pushed back by that trend line, the more likely it is to go through it at some point.
The 25-wk cycle which bottomed 4 weeks ago has provided support above a former low, but has not been able to force prices through the secondary trend line. This may change over the next two or three weeks if the market has a final rally into early August. If GLD can overcome its trend line, it can move at least to 159/160 during this time period. That would fall short of challenging the main downtrend line and could be all the upside we get before the intermediate correction resumes its downward course.
USO (United States Oil Fund)
After a protracted decline which created an extremely oversold condition, USO is rallying after meeting an interim phase objective. The index could pause here, but has the potential of moving up
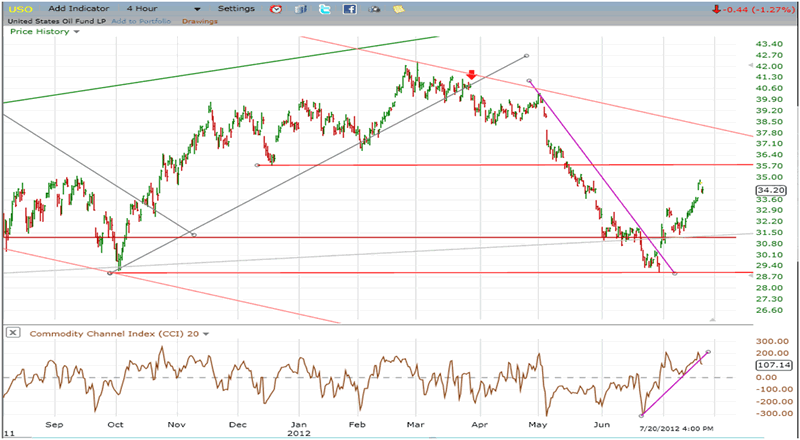
to about 36 before running into overhead resistance. It has already rallied 50% of its last phase decline and, at 36, would make it a .618 retracement. This is also where it would run into its 200-DMA. New lows are likely to follow this rally as USO appears to have resumed its long-term downtrend from its high of 119.17 on 7/06/08.
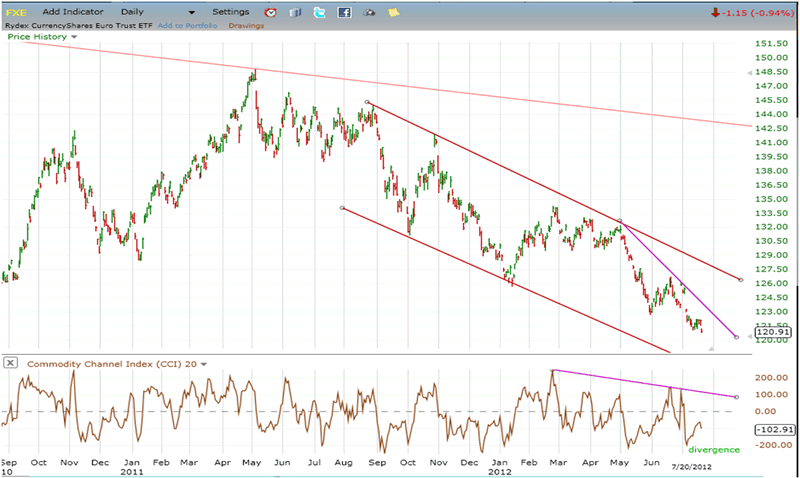
FXE (Euro Trust ETF)
As a consequence of severe political and economic difficulties experienced by the Eurozone, the Euro has been in a severe decline since its high of May 2011. However, there are important signals suggesting that this decline may be coming to an end -- at least temporarily. Positive divergence is showing in the weekly, daily, and hourly indicators, and FXE has met an intermediate projection, which suggests that it is more likely to find support in this area than to continue declining.
This fits in with the market position which calls for a rally extension into the first week in August before the intermediate top is achieved. There is a strong correlation between strength in the Euro and strength in the stock market
The SPX has started to correct after making a minimal higher high in the rally which started at 1267 on 6/04. After a minor correction, it is expected to move higher over the next three weeks, perhaps reaching the low 1400s.
A survey of various market components reveals a less than bullish picture. Storm clouds are gathering which call for caution after this rally is over. The question is whether the atmospheric disturbance due at that time will only be a tropical depression or a full-blown, type 5 hurricane. In either case, precautionary measures should be taken until the strength of the disturbance can be assessed.
FREE TRIAL SUBSCRIPTON
If precision in market timing for all time framesis something that you find important, you should
Consider taking a trial subscription to my service. It is free, and you will have four weeks to evaluate its worth. It embodies many years of research with the eventual goal of understanding as perfectly as possible how the market functions. I believe that I have achieved this goal.
For a FREE 4-week trial, Send an email to: ajg@cybertrails.com
For further subscription options, payment plans, and for important general information, I encourage
you to visit my website at www.marketurningpoints.com. It contains summaries of my background, my
investment and trading strategies, and my unique method of intra-day communication with
subscribers. I have also started an archive of former newsletters so that you can not only evaluate past performance, but also be aware of the increasing accuracy of forecasts.
Disclaimer - The above comments about the financial markets are based purely on what I consider to be sound technical analysis principles uncompromised by fundamental considerations. They represent my own opinion and are not meant to be construed as trading or investment advice, but are offered as an analytical point of view which might be of interest to those who follow stock market cycles and technical analysis.
Andre Gratian Archive |
© 2005-2022 http://www.MarketOracle.co.uk - The Market Oracle is a FREE Daily Financial Markets Analysis & Forecasting online publication.